29
/
en
AIzaSyAYiBZKx7MnpbEhh9jyipgxe19OcubqV5w
April 1, 2024
250221
St. Kitts and Nevis
KNA
true
2
1
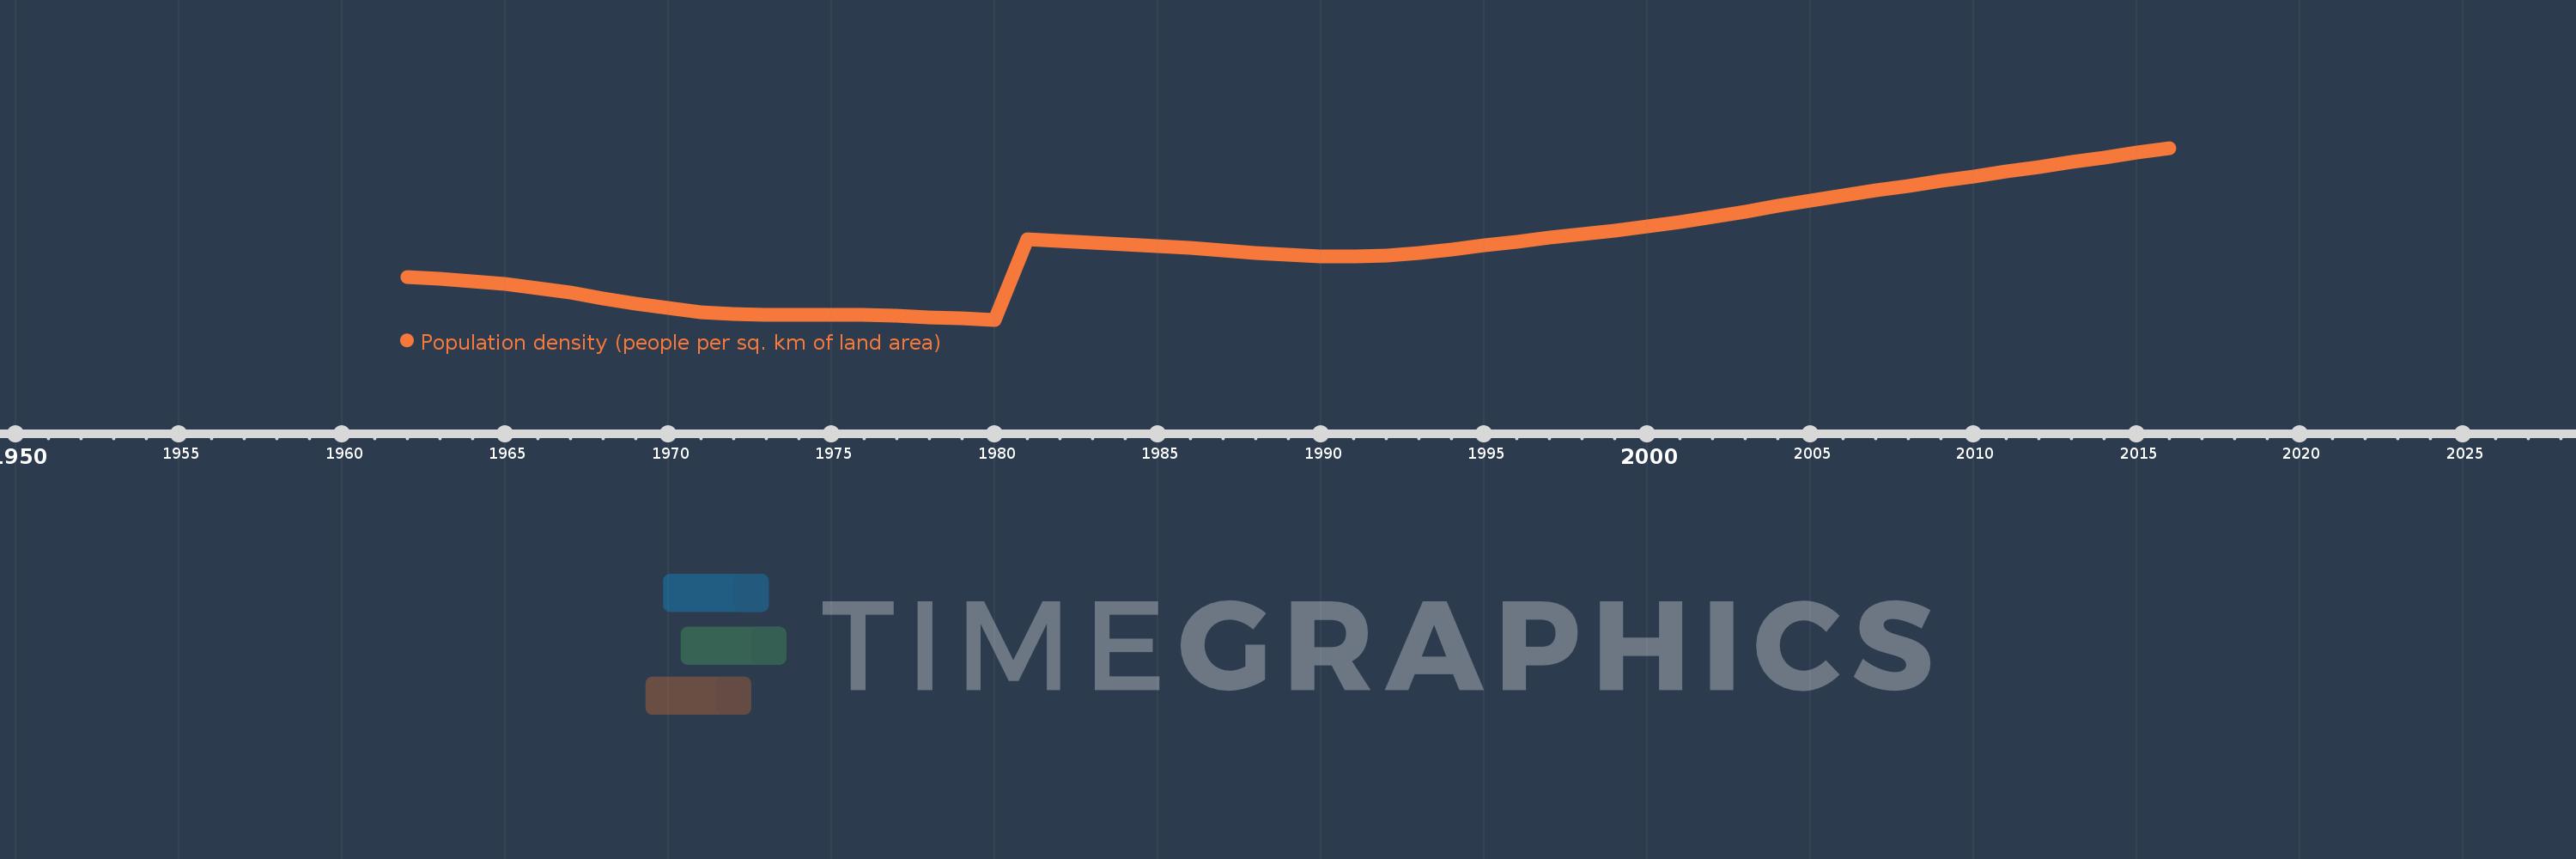
Population density (people per sq. km of land area)
2016,2015,2014,2013,2012,2011,2010,2009,2008,2007,2006,2005,2004,2003,2002,2001,2000,1999,1998,1997,1996,1995,1994,1993,1992,1991,1990,1989,1988,1987,1986,1985,1984,1983,1982,1981,1980,1979,1978,1977,1976,1975,1974,1973,1972,1971,1970,1969,1968,1967,1966,1965,1964,1963,1962
This statistics in other country:
AfghanistanAlbaniaAlgeriaAmerican SamoaAndorraAngolaAntigua and BarbudaArab WorldArgentinaArmeniaArubaAustraliaAustriaAzerbaijanBahamas, TheBahrainBangladeshBarbadosBelarusBelgiumBelizeBeninBermudaBhutanBoliviaBosnia and HerzegovinaBotswanaBrazilBritish Virgin IslandsBrunei DarussalamBulgariaBurkina FasoBurundiCabo VerdeCambodiaCameroonCanadaCaribbean small statesCayman IslandsCentral African RepublicCentral Europe and the BalticsChadChannel IslandsChileChinaColombiaComorosCongo, Dem. Rep.Congo, Rep.Costa RicaCote d'IvoireCroatiaCubaCuracaoCyprusCzech RepublicDenmarkDjiboutiDominicaDominican RepublicEarly-demographic dividendEast Asia & PacificEast Asia & Pacific (excluding high income)East Asia & Pacific (IDA & IBRD countries)EcuadorEgypt, Arab Rep.El SalvadorEquatorial GuineaEritreaEstoniaEthiopiaEuro areaEurope & Central AsiaEurope & Central Asia (excluding high income)Europe & Central Asia (IDA & IBRD countries)European UnionFaroe IslandsFijiFinlandFragile and conflict affected situationsFranceFrench PolynesiaGabonGambia, TheGeorgiaGermanyGhanaGibraltarGreeceGreenlandGrenadaGuamGuatemalaGuineaGuinea-BissauGuyanaHaitiHeavily indebted poor countries (HIPC)High incomeHondurasHong Kong SAR, ChinaHungaryIBRD onlyIcelandIDA & IBRD totalIDA blendIDA onlyIDA totalIndiaIndonesiaIran, Islamic Rep.IraqIrelandIsle of ManIsraelItalyJamaicaJapanJordanKazakhstanKenyaKiribatiKorea, Dem. People’s Rep.Korea, Rep.KosovoKuwaitKyrgyz RepublicLao PDRLate-demographic dividendLatin America & Caribbean Latin America & Caribbean (excluding high income)Latin America & the Caribbean (IDA & IBRD countries)LatviaLeast developed countries: UN classificationLebanonLesothoLiberiaLibyaLiechtensteinLithuaniaLow & middle incomeLow incomeLower middle incomeLuxembourgMacao SAR, ChinaMacedonia, FYRMadagascarMalawiMalaysiaMaldivesMaliMaltaMarshall IslandsMauritaniaMauritiusMexicoMicronesia, Fed. Sts.Middle East & North AfricaMiddle East & North Africa (excluding high income)Middle East & North Africa (IDA & IBRD countries)Middle incomeMoldovaMonacoMongoliaMontenegroMoroccoMozambiqueMyanmarNamibiaNauruNepalNetherlandsNew CaledoniaNew ZealandNicaraguaNigerNigeriaNorth AmericaNorthern Mariana IslandsNorwayOECD membersOmanOther small statesPacific island small statesPakistanPalauPanamaPapua New GuineaParaguayPeruPhilippinesPolandPortugalPost-demographic dividendPre-demographic dividendPuerto RicoQatarRomaniaRussian FederationRwandaSamoaSan MarinoSao Tome and PrincipeSaudi ArabiaSenegalSerbiaSeychellesSierra LeoneSingaporeSint Maarten (Dutch part)Slovak RepublicSloveniaSmall statesSolomon IslandsSomaliaSouth AfricaSouth AsiaSouth Asia (IDA & IBRD)SpainSri LankaSt. Kitts and NevisSt. LuciaSt. Martin (French part)St. Vincent and the GrenadinesSub-Saharan Africa Sub-Saharan Africa (excluding high income)Sub-Saharan Africa (IDA & IBRD countries)SudanSurinameSwazilandSwedenSwitzerlandSyrian Arab RepublicTajikistanTanzaniaThailandTimor-LesteTogoTongaTrinidad and TobagoTunisiaTurkeyTurkmenistanTurks and Caicos IslandsTuvaluUgandaUkraineUnited Arab EmiratesUnited KingdomUnited StatesUpper middle incomeUruguayUzbekistanVanuatuVenezuela, RBVietnamVirgin Islands (U.S.)West Bank and GazaWorldYemen, Rep.ZambiaZimbabwe Timeline:
This timeline shows a graph from 1962 to 2016 of St. Kitts and Nevis. No data until 1961. Number of actual observations by date: 55.
Source name:
World Development Indicators
Source organization:
Food and Agriculture Organization and World Bank population estimates.
Categories, topics:
Urban Development
Last updated:
apr 23, 2017
Indicators value changes by year
Minimum:
124.143
jan 1, 1980
Maximum:
213.738
jan 1, 2016
At the date of observation
Value
Absolute change
Change from previous value
jan 1, 1962
146.271
+146.271
0.0%
jan 1, 1963
145.617
-0.654
-0.45%
jan 1, 1964
144.38
-1.237
-0.85%
jan 1, 1965
142.669
-1.711
-1.19%
jan 1, 1966
140.603
-2.066
-1.45%
jan 1, 1967
138.157
-2.446
-1.74%
jan 1, 1968
135.38
-2.777
-2.01%
jan 1, 1969
132.569
-2.811
-2.08%
jan 1, 1970
130.097
-2.471
-1.86%
jan 1, 1971
128.234
-1.863
-1.43%
jan 1, 1972
127.114
-1.12
-0.87%
jan 1, 1973
126.651
-0.463
-0.36%
jan 1, 1974
126.611
-0.04
-0.03%
jan 1, 1975
126.649
+0.037
0.03%
jan 1, 1976
126.509
-0.14
-0.11%
jan 1, 1977
126.12
-0.389
-0.31%
jan 1, 1978
125.56
-0.56
-0.44%
jan 1, 1979
124.869
-0.691
-0.55%
jan 1, 1980
124.143
-0.726
-0.58%
jan 1, 1981
166.173
+42.03
33.86%
jan 1, 1982
165.3
-0.873
-0.53%
jan 1, 1983
164.465
-0.835
-0.5%
jan 1, 1984
163.612
-0.854
-0.52%
jan 1, 1985
162.669
-0.942
-0.58%
jan 1, 1986
161.604
-1.065
-0.65%
jan 1, 1987
160.373
-1.231
-0.76%
jan 1, 1988
159.05
-1.323
-0.82%
jan 1, 1989
157.865
-1.185
-0.74%
jan 1, 1990
157.131
-0.735
-0.47%
jan 1, 1991
157.05
-0.081
-0.05%
jan 1, 1992
157.727
+0.677
0.43%
jan 1, 1993
159.077
+1.35
0.86%
jan 1, 1994
160.908
+1.831
1.15%
jan 1, 1995
162.935
+2.027
1.26%
jan 1, 1996
164.954
+2.019
1.24%
jan 1, 1997
166.888
+1.935
1.17%
jan 1, 1998
168.788
+1.9
1.14%
jan 1, 1999
170.735
+1.946
1.15%
jan 1, 2000
172.838
+2.104
1.23%
jan 1, 2001
175.169
+2.331
1.35%
jan 1, 2002
177.754
+2.585
1.48%
jan 1, 2003
180.519
+2.765
1.56%
jan 1, 2004
183.388
+2.869
1.59%
jan 1, 2005
186.246
+2.858
1.56%
jan 1, 2006
188.996
+2.75
1.48%
jan 1, 2007
191.608
+2.612
1.38%
jan 1, 2008
194.096
+2.488
1.3%
jan 1, 2009
196.512
+2.415
1.24%
jan 1, 2010
198.912
+2.4
1.22%
jan 1, 2011
201.354
+2.442
1.23%
jan 1, 2012
203.838
+2.485
1.23%
jan 1, 2013
206.346
+2.508
1.23%
jan 1, 2014
208.85
+2.504
1.21%
jan 1, 2015
211.323
+2.473
1.18%
jan 1, 2016
213.738
+2.415
1.14%
Ranking of countries by current statistics by years


Comments: