29
/
en
AIzaSyAYiBZKx7MnpbEhh9jyipgxe19OcubqV5w
April 1, 2024
123994
Ecuador
ECU
true
2
1
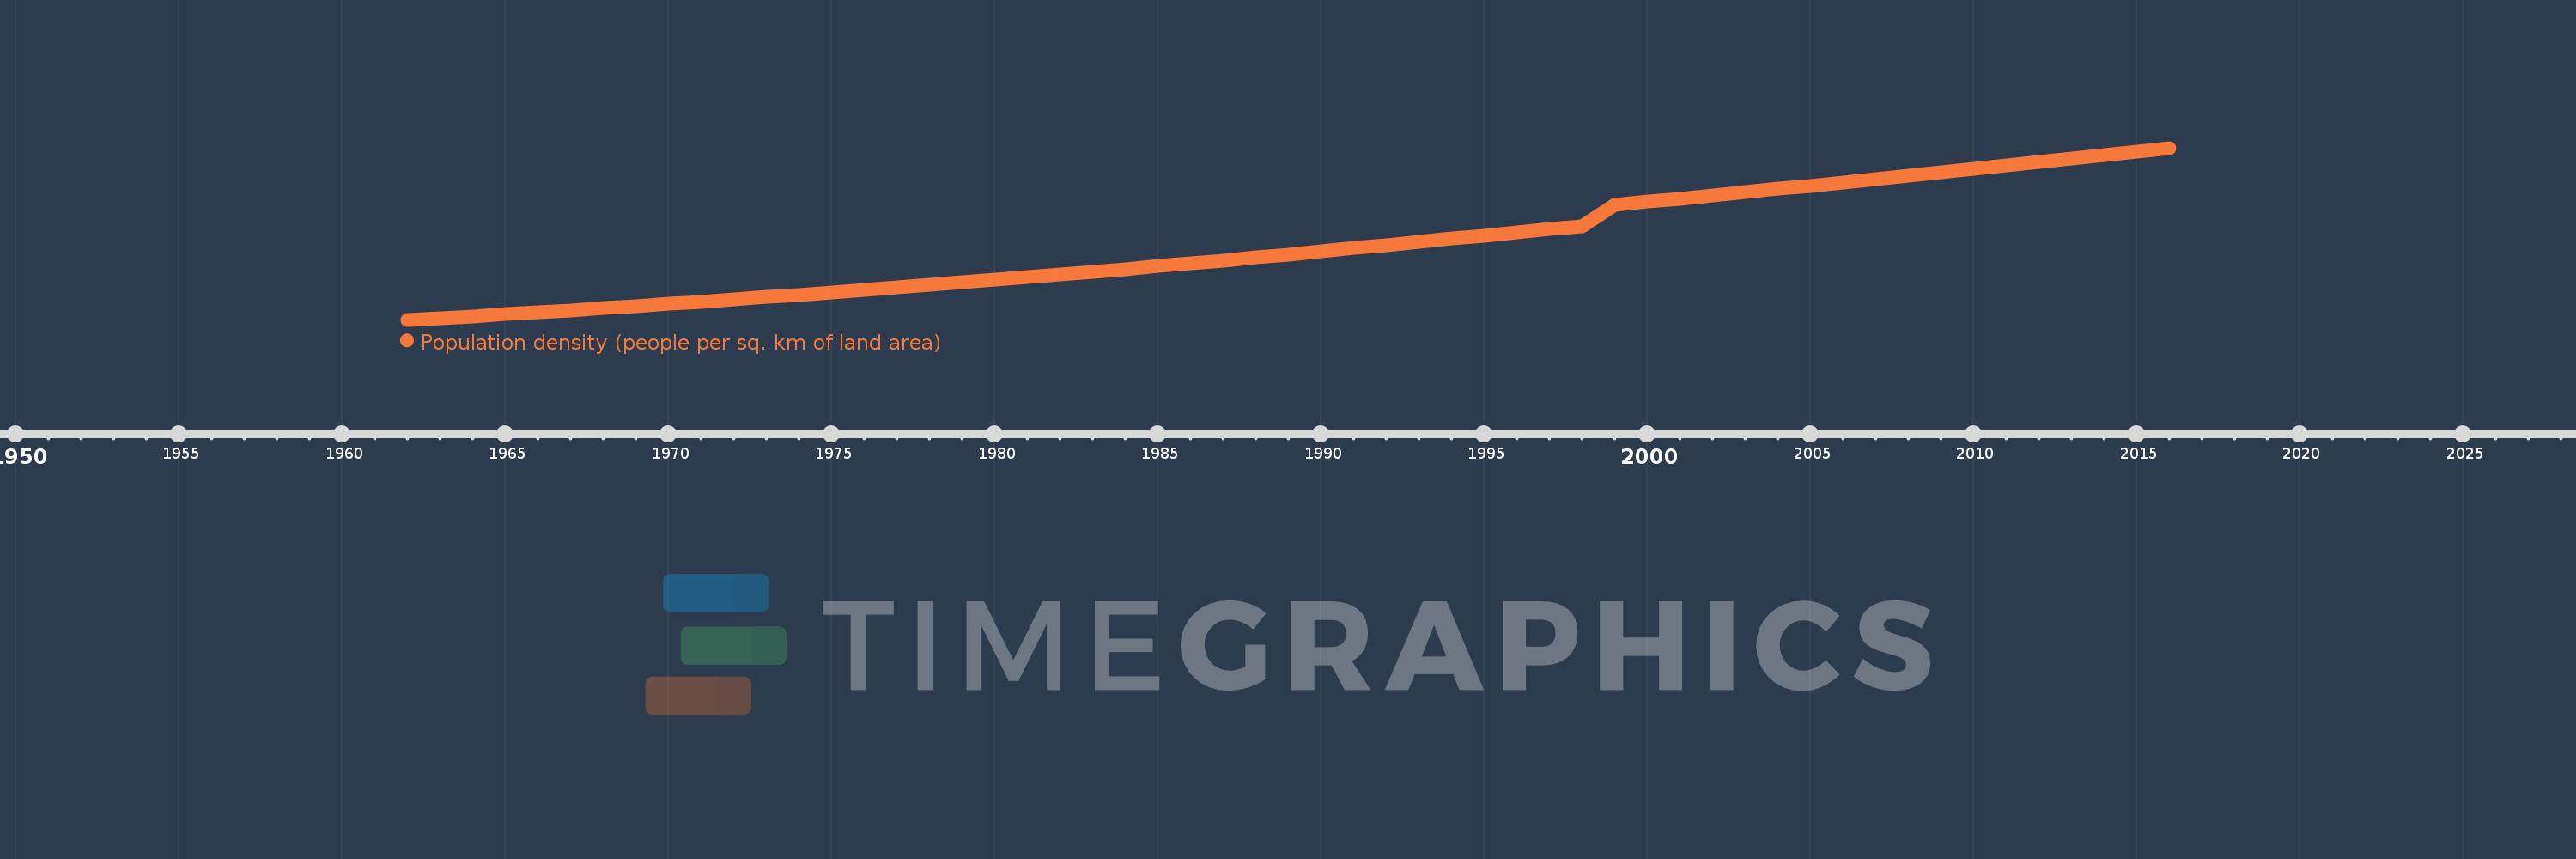
Population density (people per sq. km of land area)
2016,2015,2014,2013,2012,2011,2010,2009,2008,2007,2006,2005,2004,2003,2002,2001,2000,1999,1998,1997,1996,1995,1994,1993,1992,1991,1990,1989,1988,1987,1986,1985,1984,1983,1982,1981,1980,1979,1978,1977,1976,1975,1974,1973,1972,1971,1970,1969,1968,1967,1966,1965,1964,1963,1962
This statistics in other country:
AfghanistanAlbaniaAlgeriaAmerican SamoaAndorraAngolaAntigua and BarbudaArab WorldArgentinaArmeniaArubaAustraliaAustriaAzerbaijanBahamas, TheBahrainBangladeshBarbadosBelarusBelgiumBelizeBeninBermudaBhutanBoliviaBosnia and HerzegovinaBotswanaBrazilBritish Virgin IslandsBrunei DarussalamBulgariaBurkina FasoBurundiCabo VerdeCambodiaCameroonCanadaCaribbean small statesCayman IslandsCentral African RepublicCentral Europe and the BalticsChadChannel IslandsChileChinaColombiaComorosCongo, Dem. Rep.Congo, Rep.Costa RicaCote d'IvoireCroatiaCubaCuracaoCyprusCzech RepublicDenmarkDjiboutiDominicaDominican RepublicEarly-demographic dividendEast Asia & PacificEast Asia & Pacific (excluding high income)East Asia & Pacific (IDA & IBRD countries)EcuadorEgypt, Arab Rep.El SalvadorEquatorial GuineaEritreaEstoniaEthiopiaEuro areaEurope & Central AsiaEurope & Central Asia (excluding high income)Europe & Central Asia (IDA & IBRD countries)European UnionFaroe IslandsFijiFinlandFragile and conflict affected situationsFranceFrench PolynesiaGabonGambia, TheGeorgiaGermanyGhanaGibraltarGreeceGreenlandGrenadaGuamGuatemalaGuineaGuinea-BissauGuyanaHaitiHeavily indebted poor countries (HIPC)High incomeHondurasHong Kong SAR, ChinaHungaryIBRD onlyIcelandIDA & IBRD totalIDA blendIDA onlyIDA totalIndiaIndonesiaIran, Islamic Rep.IraqIrelandIsle of ManIsraelItalyJamaicaJapanJordanKazakhstanKenyaKiribatiKorea, Dem. People’s Rep.Korea, Rep.KosovoKuwaitKyrgyz RepublicLao PDRLate-demographic dividendLatin America & Caribbean Latin America & Caribbean (excluding high income)Latin America & the Caribbean (IDA & IBRD countries)LatviaLeast developed countries: UN classificationLebanonLesothoLiberiaLibyaLiechtensteinLithuaniaLow & middle incomeLow incomeLower middle incomeLuxembourgMacao SAR, ChinaMacedonia, FYRMadagascarMalawiMalaysiaMaldivesMaliMaltaMarshall IslandsMauritaniaMauritiusMexicoMicronesia, Fed. Sts.Middle East & North AfricaMiddle East & North Africa (excluding high income)Middle East & North Africa (IDA & IBRD countries)Middle incomeMoldovaMonacoMongoliaMontenegroMoroccoMozambiqueMyanmarNamibiaNauruNepalNetherlandsNew CaledoniaNew ZealandNicaraguaNigerNigeriaNorth AmericaNorthern Mariana IslandsNorwayOECD membersOmanOther small statesPacific island small statesPakistanPalauPanamaPapua New GuineaParaguayPeruPhilippinesPolandPortugalPost-demographic dividendPre-demographic dividendPuerto RicoQatarRomaniaRussian FederationRwandaSamoaSan MarinoSao Tome and PrincipeSaudi ArabiaSenegalSerbiaSeychellesSierra LeoneSingaporeSint Maarten (Dutch part)Slovak RepublicSloveniaSmall statesSolomon IslandsSomaliaSouth AfricaSouth AsiaSouth Asia (IDA & IBRD)SpainSri LankaSt. Kitts and NevisSt. LuciaSt. Martin (French part)St. Vincent and the GrenadinesSub-Saharan Africa Sub-Saharan Africa (excluding high income)Sub-Saharan Africa (IDA & IBRD countries)SudanSurinameSwazilandSwedenSwitzerlandSyrian Arab RepublicTajikistanTanzaniaThailandTimor-LesteTogoTongaTrinidad and TobagoTunisiaTurkeyTurkmenistanTurks and Caicos IslandsTuvaluUgandaUkraineUnited Arab EmiratesUnited KingdomUnited StatesUpper middle incomeUruguayUzbekistanVanuatuVenezuela, RBVietnamVirgin Islands (U.S.)West Bank and GazaWorldYemen, Rep.ZambiaZimbabwe Timeline:
This timeline shows a graph from 1962 to 2016 of Ecuador. No data until 1961. Number of actual observations by date: 55.
Source name:
World Development Indicators
Source organization:
Food and Agriculture Organization and World Bank population estimates.
Categories, topics:
Urban Development
Last updated:
apr 23, 2017
Indicators value changes by year
Minimum:
16.894
jan 1, 1962
Maximum:
65.004
jan 1, 2016
At the date of observation
Value
Absolute change
Change from previous value
jan 1, 1962
16.894
+16.894
0.0%
jan 1, 1963
17.385
+0.491
2.91%
jan 1, 1964
17.894
+0.509
2.93%
jan 1, 1965
18.42
+0.526
2.94%
jan 1, 1966
18.964
+0.544
2.95%
jan 1, 1967
19.526
+0.562
2.96%
jan 1, 1968
20.106
+0.579
2.97%
jan 1, 1969
20.701
+0.595
2.96%
jan 1, 1970
21.311
+0.61
2.95%
jan 1, 1971
21.935
+0.624
2.93%
jan 1, 1972
22.572
+0.637
2.9%
jan 1, 1973
23.222
+0.65
2.88%
jan 1, 1974
23.884
+0.662
2.85%
jan 1, 1975
24.556
+0.673
2.82%
jan 1, 1976
25.24
+0.683
2.78%
jan 1, 1977
25.933
+0.694
2.75%
jan 1, 1978
26.637
+0.704
2.71%
jan 1, 1979
27.351
+0.714
2.68%
jan 1, 1980
28.076
+0.725
2.65%
jan 1, 1981
28.812
+0.736
2.62%
jan 1, 1982
29.559
+0.747
2.59%
jan 1, 1983
30.317
+0.758
2.56%
jan 1, 1984
31.087
+0.77
2.54%
jan 1, 1985
31.873
+0.786
2.53%
jan 1, 1986
32.676
+0.803
2.52%
jan 1, 1987
33.496
+0.82
2.51%
jan 1, 1988
34.331
+0.835
2.49%
jan 1, 1989
35.18
+0.849
2.47%
jan 1, 1990
36.04
+0.86
2.45%
jan 1, 1991
36.91
+0.869
2.41%
jan 1, 1992
37.787
+0.877
2.38%
jan 1, 1993
38.671
+0.884
2.34%
jan 1, 1994
39.558
+0.887
2.29%
jan 1, 1995
40.444
+0.886
2.24%
jan 1, 1996
41.326
+0.882
2.18%
jan 1, 1997
42.203
+0.877
2.12%
jan 1, 1998
43.075
+0.872
2.07%
jan 1, 1999
48.977
+5.901
13.7%
jan 1, 2000
49.922
+0.945
1.93%
jan 1, 2001
50.848
+0.926
1.85%
jan 1, 2002
51.75
+0.903
1.77%
jan 1, 2003
52.633
+0.883
1.71%
jan 1, 2004
53.509
+0.876
1.66%
jan 1, 2005
54.395
+0.886
1.66%
jan 1, 2006
55.304
+0.908
1.67%
jan 1, 2007
56.239
+0.935
1.69%
jan 1, 2008
57.197
+0.958
1.7%
jan 1, 2009
58.172
+0.975
1.7%
jan 1, 2010
59.153
+0.981
1.69%
jan 1, 2011
60.133
+0.98
1.66%
jan 1, 2012
61.11
+0.977
1.62%
jan 1, 2013
62.085
+0.975
1.6%
jan 1, 2014
63.059
+0.974
1.57%
jan 1, 2015
64.032
+0.973
1.54%
jan 1, 2016
65.004
+0.972
1.52%
Ranking of countries by current statistics by years


Comments: