29
/
en
AIzaSyAYiBZKx7MnpbEhh9jyipgxe19OcubqV5w
April 1, 2024
72475
Aruba
ABW
true
2
1
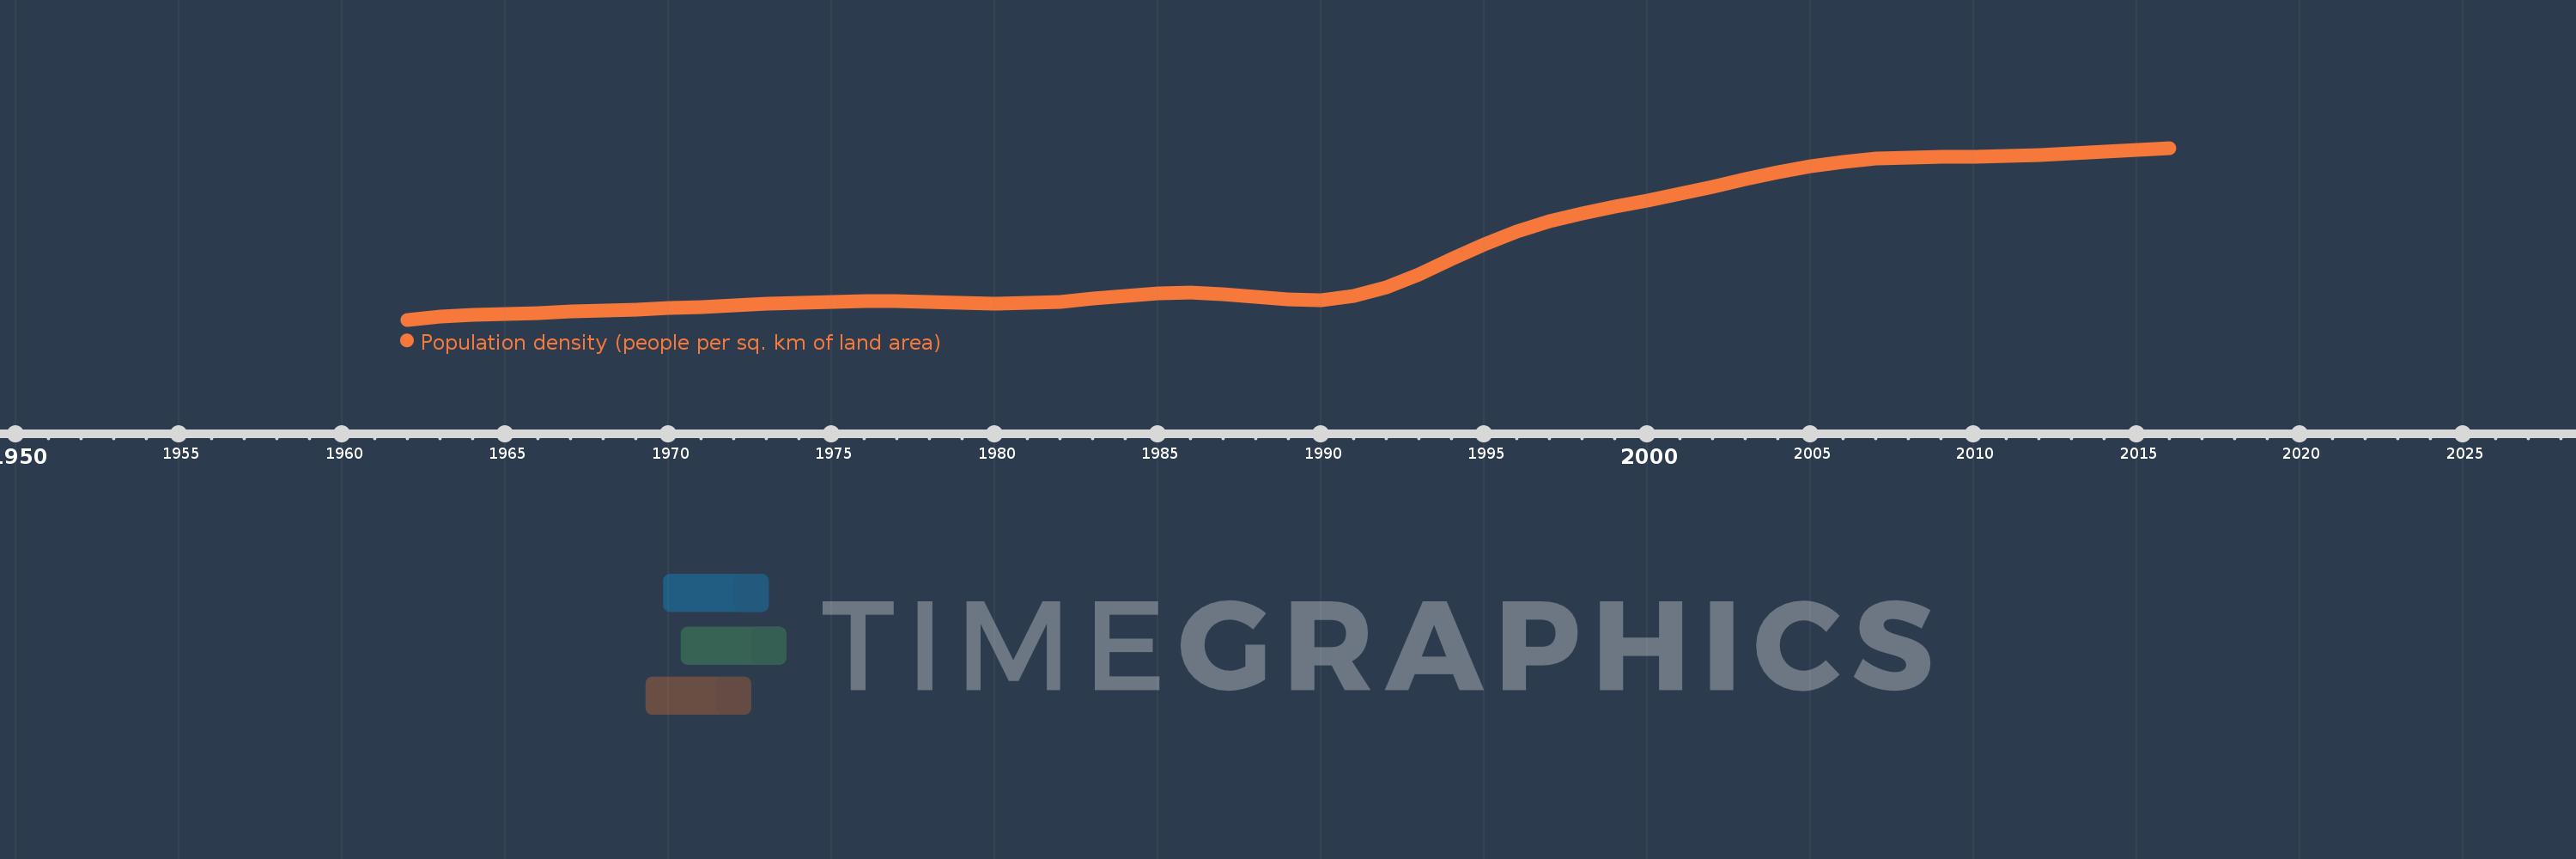
Population density (people per sq. km of land area)
2016,2015,2014,2013,2012,2011,2010,2009,2008,2007,2006,2005,2004,2003,2002,2001,2000,1999,1998,1997,1996,1995,1994,1993,1992,1991,1990,1989,1988,1987,1986,1985,1984,1983,1982,1981,1980,1979,1978,1977,1976,1975,1974,1973,1972,1971,1970,1969,1968,1967,1966,1965,1964,1963,1962
This statistics in other country:
AfghanistanAlbaniaAlgeriaAmerican SamoaAndorraAngolaAntigua and BarbudaArab WorldArgentinaArmeniaArubaAustraliaAustriaAzerbaijanBahamas, TheBahrainBangladeshBarbadosBelarusBelgiumBelizeBeninBermudaBhutanBoliviaBosnia and HerzegovinaBotswanaBrazilBritish Virgin IslandsBrunei DarussalamBulgariaBurkina FasoBurundiCabo VerdeCambodiaCameroonCanadaCaribbean small statesCayman IslandsCentral African RepublicCentral Europe and the BalticsChadChannel IslandsChileChinaColombiaComorosCongo, Dem. Rep.Congo, Rep.Costa RicaCote d'IvoireCroatiaCubaCuracaoCyprusCzech RepublicDenmarkDjiboutiDominicaDominican RepublicEarly-demographic dividendEast Asia & PacificEast Asia & Pacific (excluding high income)East Asia & Pacific (IDA & IBRD countries)EcuadorEgypt, Arab Rep.El SalvadorEquatorial GuineaEritreaEstoniaEthiopiaEuro areaEurope & Central AsiaEurope & Central Asia (excluding high income)Europe & Central Asia (IDA & IBRD countries)European UnionFaroe IslandsFijiFinlandFragile and conflict affected situationsFranceFrench PolynesiaGabonGambia, TheGeorgiaGermanyGhanaGibraltarGreeceGreenlandGrenadaGuamGuatemalaGuineaGuinea-BissauGuyanaHaitiHeavily indebted poor countries (HIPC)High incomeHondurasHong Kong SAR, ChinaHungaryIBRD onlyIcelandIDA & IBRD totalIDA blendIDA onlyIDA totalIndiaIndonesiaIran, Islamic Rep.IraqIrelandIsle of ManIsraelItalyJamaicaJapanJordanKazakhstanKenyaKiribatiKorea, Dem. People’s Rep.Korea, Rep.KosovoKuwaitKyrgyz RepublicLao PDRLate-demographic dividendLatin America & Caribbean Latin America & Caribbean (excluding high income)Latin America & the Caribbean (IDA & IBRD countries)LatviaLeast developed countries: UN classificationLebanonLesothoLiberiaLibyaLiechtensteinLithuaniaLow & middle incomeLow incomeLower middle incomeLuxembourgMacao SAR, ChinaMacedonia, FYRMadagascarMalawiMalaysiaMaldivesMaliMaltaMarshall IslandsMauritaniaMauritiusMexicoMicronesia, Fed. Sts.Middle East & North AfricaMiddle East & North Africa (excluding high income)Middle East & North Africa (IDA & IBRD countries)Middle incomeMoldovaMonacoMongoliaMontenegroMoroccoMozambiqueMyanmarNamibiaNauruNepalNetherlandsNew CaledoniaNew ZealandNicaraguaNigerNigeriaNorth AmericaNorthern Mariana IslandsNorwayOECD membersOmanOther small statesPacific island small statesPakistanPalauPanamaPapua New GuineaParaguayPeruPhilippinesPolandPortugalPost-demographic dividendPre-demographic dividendPuerto RicoQatarRomaniaRussian FederationRwandaSamoaSan MarinoSao Tome and PrincipeSaudi ArabiaSenegalSerbiaSeychellesSierra LeoneSingaporeSint Maarten (Dutch part)Slovak RepublicSloveniaSmall statesSolomon IslandsSomaliaSouth AfricaSouth AsiaSouth Asia (IDA & IBRD)SpainSri LankaSt. Kitts and NevisSt. LuciaSt. Martin (French part)St. Vincent and the GrenadinesSub-Saharan Africa Sub-Saharan Africa (excluding high income)Sub-Saharan Africa (IDA & IBRD countries)SudanSurinameSwazilandSwedenSwitzerlandSyrian Arab RepublicTajikistanTanzaniaThailandTimor-LesteTogoTongaTrinidad and TobagoTunisiaTurkeyTurkmenistanTurks and Caicos IslandsTuvaluUgandaUkraineUnited Arab EmiratesUnited KingdomUnited StatesUpper middle incomeUruguayUzbekistanVanuatuVenezuela, RBVietnamVirgin Islands (U.S.)West Bank and GazaWorldYemen, Rep.ZambiaZimbabwe Timeline:
This timeline shows a graph from 1962 to 2016 of Aruba. No data until 1961. Number of actual observations by date: 55.
Source name:
World Development Indicators
Source organization:
Food and Agriculture Organization and World Bank population estimates.
Categories, topics:
Urban Development
Last updated:
apr 23, 2017
Indicators value changes by year
Minimum:
307.972
jan 1, 1962
Maximum:
577.161
jan 1, 2016
At the date of observation
Value
Absolute change
Change from previous value
jan 1, 1962
307.972
+307.972
0.0%
jan 1, 1963
312.367
+4.394
1.43%
jan 1, 1964
314.983
+2.617
0.84%
jan 1, 1965
316.828
+1.844
0.59%
jan 1, 1966
318.667
+1.839
0.58%
jan 1, 1967
320.622
+1.956
0.61%
jan 1, 1968
322.494
+1.872
0.58%
jan 1, 1969
324.361
+1.867
0.58%
jan 1, 1970
326.244
+1.883
0.58%
jan 1, 1971
328.139
+1.894
0.58%
jan 1, 1972
330.211
+2.072
0.63%
jan 1, 1973
332.494
+2.283
0.69%
jan 1, 1974
334.661
+2.167
0.65%
jan 1, 1975
336.25
+1.589
0.47%
jan 1, 1976
336.972
+0.722
0.21%
jan 1, 1977
336.606
-0.367
-0.11%
jan 1, 1978
335.367
-1.239
-0.37%
jan 1, 1979
333.922
-1.444
-0.43%
jan 1, 1980
333.211
-0.711
-0.21%
jan 1, 1981
333.867
+0.656
0.2%
jan 1, 1982
336.483
+2.617
0.78%
jan 1, 1983
340.8
+4.317
1.28%
jan 1, 1984
345.578
+4.778
1.4%
jan 1, 1985
349.061
+3.483
1.01%
jan 1, 1986
350.156
+1.094
0.31%
jan 1, 1987
348.022
-2.133
-0.61%
jan 1, 1988
343.528
-4.494
-1.29%
jan 1, 1989
339.317
-4.211
-1.23%
jan 1, 1990
339.067
-0.25
-0.07%
jan 1, 1991
345.267
+6.2
1.83%
jan 1, 1992
359.017
+13.75
3.98%
jan 1, 1993
379.083
+20.067
5.59%
jan 1, 1994
402.767
+23.683
6.25%
jan 1, 1995
426.111
+23.344
5.8%
jan 1, 1996
446.256
+20.144
4.73%
jan 1, 1997
462.194
+15.939
3.57%
jan 1, 1998
474.706
+12.511
2.71%
jan 1, 1999
484.867
+10.161
2.14%
jan 1, 2000
494.467
+9.6
1.98%
jan 1, 2001
504.767
+10.3
2.08%
jan 1, 2002
516.078
+11.311
2.24%
jan 1, 2003
527.75
+11.672
2.26%
jan 1, 2004
538.972
+11.222
2.13%
jan 1, 2005
548.567
+9.594
1.78%
jan 1, 2006
555.728
+7.161
1.31%
jan 1, 2007
560.167
+4.439
0.8%
jan 1, 2008
562.322
+2.156
0.38%
jan 1, 2009
563.011
+0.689
0.12%
jan 1, 2010
563.422
+0.411
0.07%
jan 1, 2011
564.428
+1.006
0.18%
jan 1, 2012
566.311
+1.883
0.33%
jan 1, 2013
568.85
+2.539
0.45%
jan 1, 2014
571.783
+2.933
0.52%
jan 1, 2015
574.672
+2.889
0.51%
jan 1, 2016
577.161
+2.489
0.43%
Ranking of countries by current statistics by years


Comments: