29
/
en
AIzaSyAYiBZKx7MnpbEhh9jyipgxe19OcubqV5w
April 1, 2024
115255
Croatia
HRV
true
2
1
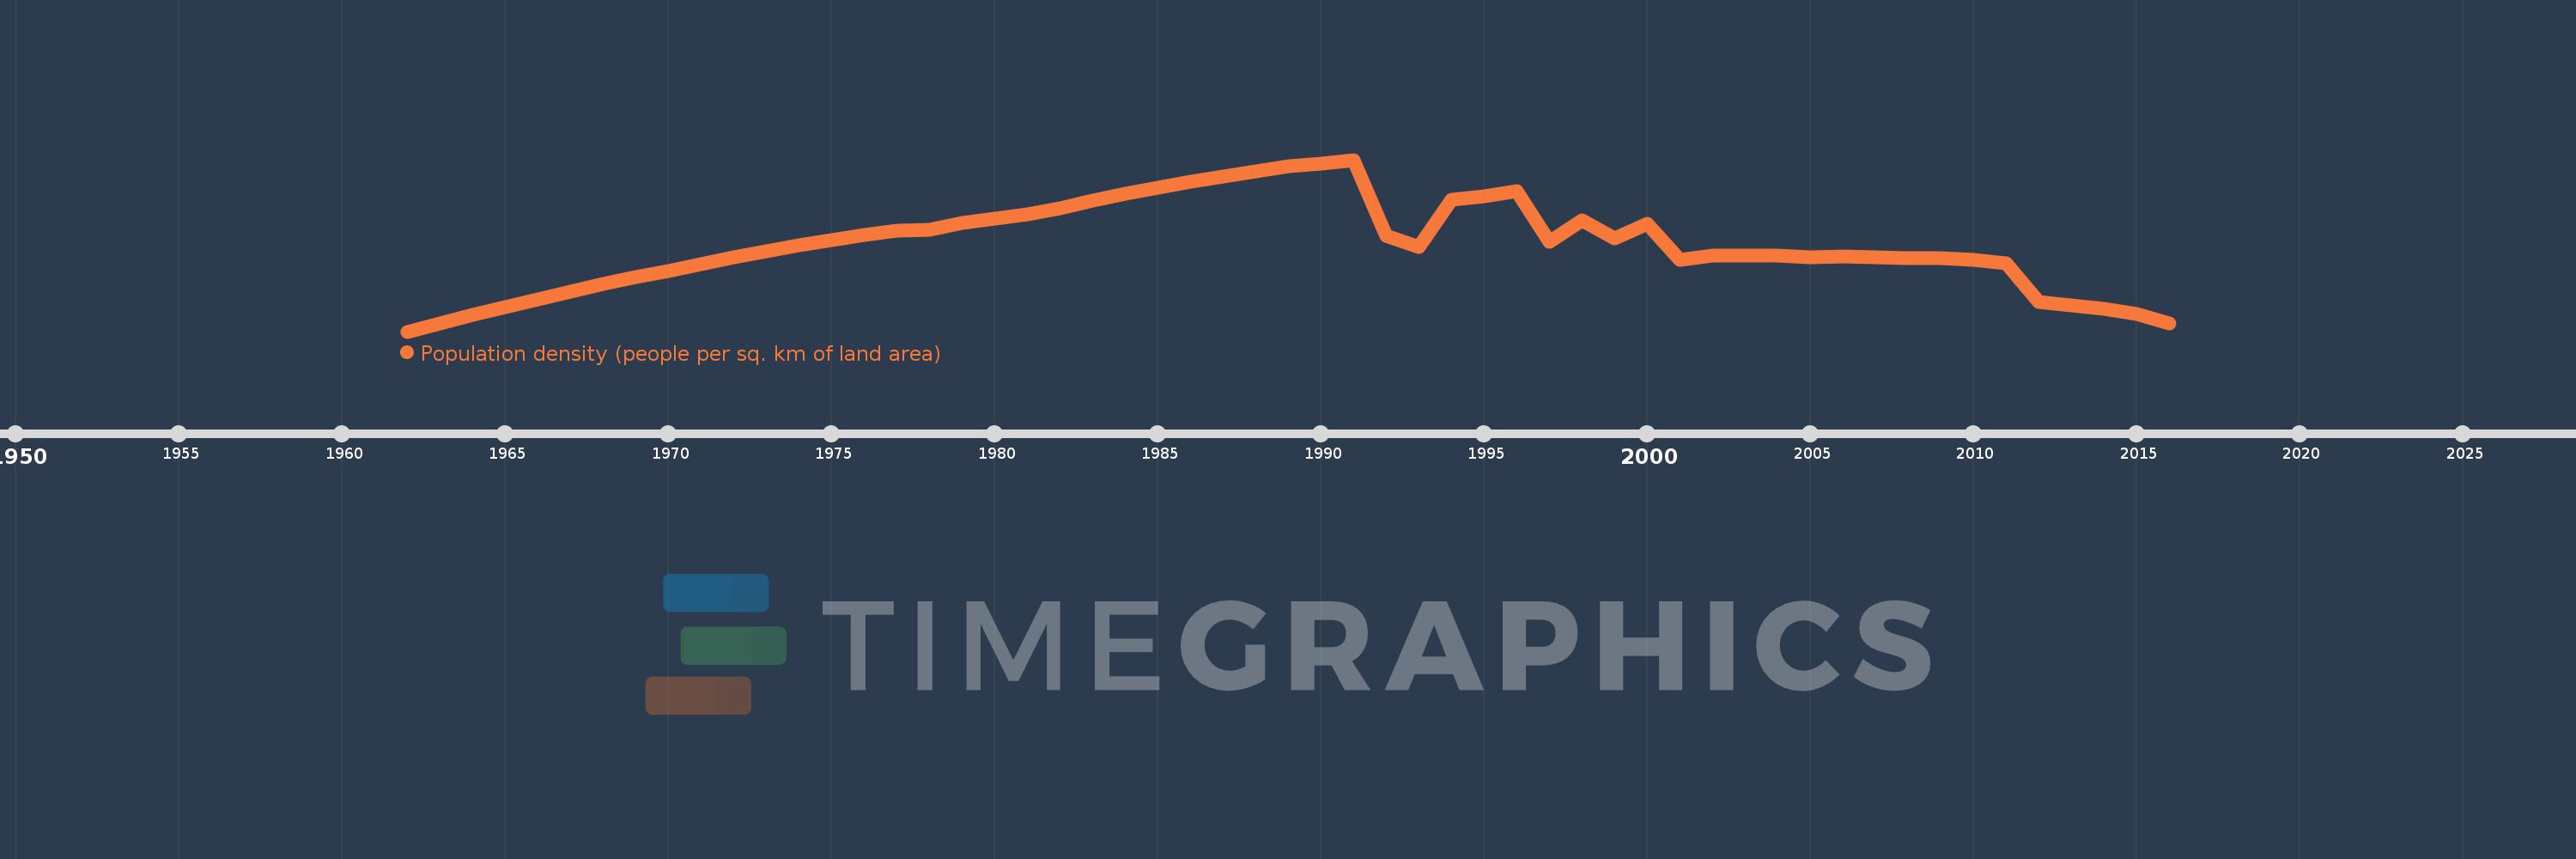
Population density (people per sq. km of land area)
2016,2015,2014,2013,2012,2011,2010,2009,2008,2007,2006,2005,2004,2003,2002,2001,2000,1999,1998,1997,1996,1995,1994,1993,1992,1991,1990,1989,1988,1987,1986,1985,1984,1983,1982,1981,1980,1979,1978,1977,1976,1975,1974,1973,1972,1971,1970,1969,1968,1967,1966,1965,1964,1963,1962
This statistics in other country:
AfghanistanAlbaniaAlgeriaAmerican SamoaAndorraAngolaAntigua and BarbudaArab WorldArgentinaArmeniaArubaAustraliaAustriaAzerbaijanBahamas, TheBahrainBangladeshBarbadosBelarusBelgiumBelizeBeninBermudaBhutanBoliviaBosnia and HerzegovinaBotswanaBrazilBritish Virgin IslandsBrunei DarussalamBulgariaBurkina FasoBurundiCabo VerdeCambodiaCameroonCanadaCaribbean small statesCayman IslandsCentral African RepublicCentral Europe and the BalticsChadChannel IslandsChileChinaColombiaComorosCongo, Dem. Rep.Congo, Rep.Costa RicaCote d'IvoireCroatiaCubaCuracaoCyprusCzech RepublicDenmarkDjiboutiDominicaDominican RepublicEarly-demographic dividendEast Asia & PacificEast Asia & Pacific (excluding high income)East Asia & Pacific (IDA & IBRD countries)EcuadorEgypt, Arab Rep.El SalvadorEquatorial GuineaEritreaEstoniaEthiopiaEuro areaEurope & Central AsiaEurope & Central Asia (excluding high income)Europe & Central Asia (IDA & IBRD countries)European UnionFaroe IslandsFijiFinlandFragile and conflict affected situationsFranceFrench PolynesiaGabonGambia, TheGeorgiaGermanyGhanaGibraltarGreeceGreenlandGrenadaGuamGuatemalaGuineaGuinea-BissauGuyanaHaitiHeavily indebted poor countries (HIPC)High incomeHondurasHong Kong SAR, ChinaHungaryIBRD onlyIcelandIDA & IBRD totalIDA blendIDA onlyIDA totalIndiaIndonesiaIran, Islamic Rep.IraqIrelandIsle of ManIsraelItalyJamaicaJapanJordanKazakhstanKenyaKiribatiKorea, Dem. People’s Rep.Korea, Rep.KosovoKuwaitKyrgyz RepublicLao PDRLate-demographic dividendLatin America & Caribbean Latin America & Caribbean (excluding high income)Latin America & the Caribbean (IDA & IBRD countries)LatviaLeast developed countries: UN classificationLebanonLesothoLiberiaLibyaLiechtensteinLithuaniaLow & middle incomeLow incomeLower middle incomeLuxembourgMacao SAR, ChinaMacedonia, FYRMadagascarMalawiMalaysiaMaldivesMaliMaltaMarshall IslandsMauritaniaMauritiusMexicoMicronesia, Fed. Sts.Middle East & North AfricaMiddle East & North Africa (excluding high income)Middle East & North Africa (IDA & IBRD countries)Middle incomeMoldovaMonacoMongoliaMontenegroMoroccoMozambiqueMyanmarNamibiaNauruNepalNetherlandsNew CaledoniaNew ZealandNicaraguaNigerNigeriaNorth AmericaNorthern Mariana IslandsNorwayOECD membersOmanOther small statesPacific island small statesPakistanPalauPanamaPapua New GuineaParaguayPeruPhilippinesPolandPortugalPost-demographic dividendPre-demographic dividendPuerto RicoQatarRomaniaRussian FederationRwandaSamoaSan MarinoSao Tome and PrincipeSaudi ArabiaSenegalSerbiaSeychellesSierra LeoneSingaporeSint Maarten (Dutch part)Slovak RepublicSloveniaSmall statesSolomon IslandsSomaliaSouth AfricaSouth AsiaSouth Asia (IDA & IBRD)SpainSri LankaSt. Kitts and NevisSt. LuciaSt. Martin (French part)St. Vincent and the GrenadinesSub-Saharan Africa Sub-Saharan Africa (excluding high income)Sub-Saharan Africa (IDA & IBRD countries)SudanSurinameSwazilandSwedenSwitzerlandSyrian Arab RepublicTajikistanTanzaniaThailandTimor-LesteTogoTongaTrinidad and TobagoTunisiaTurkeyTurkmenistanTurks and Caicos IslandsTuvaluUgandaUkraineUnited Arab EmiratesUnited KingdomUnited StatesUpper middle incomeUruguayUzbekistanVanuatuVenezuela, RBVietnamVirgin Islands (U.S.)West Bank and GazaWorldYemen, Rep.ZambiaZimbabwe Timeline:
This timeline shows a graph from 1962 to 2016 of Croatia. No data until 1961. Number of actual observations by date: 55.
Source name:
World Development Indicators
Source organization:
Food and Agriculture Organization and World Bank population estimates.
Categories, topics:
Urban Development
Last updated:
apr 23, 2017
Indicators value changes by year
Minimum:
74.614
jan 1, 1962
Maximum:
85.495
jan 1, 1991
At the date of observation
Value
Absolute change
Change from previous value
jan 1, 1962
74.614
+74.614
0.0%
jan 1, 1963
75.158
+0.544
0.73%
jan 1, 1964
75.682
+0.524
0.7%
jan 1, 1965
76.188
+0.506
0.67%
jan 1, 1966
76.677
+0.489
0.64%
jan 1, 1967
77.142
+0.465
0.61%
jan 1, 1968
77.607
+0.465
0.6%
jan 1, 1969
78.054
+0.447
0.58%
jan 1, 1970
78.465
+0.411
0.53%
jan 1, 1971
78.895
+0.429
0.55%
jan 1, 1972
79.324
+0.429
0.54%
jan 1, 1973
79.717
+0.393
0.5%
jan 1, 1974
80.093
+0.376
0.47%
jan 1, 1975
80.433
+0.34
0.42%
jan 1, 1976
80.737
+0.304
0.38%
jan 1, 1977
81.023
+0.286
0.35%
jan 1, 1978
81.059
+0.036
0.04%
jan 1, 1979
81.488
+0.429
0.53%
jan 1, 1980
81.756
+0.268
0.33%
jan 1, 1981
82.06
+0.304
0.37%
jan 1, 1982
82.418
+0.358
0.44%
jan 1, 1983
82.901
+0.483
0.59%
jan 1, 1984
83.33
+0.429
0.52%
jan 1, 1985
83.706
+0.376
0.45%
jan 1, 1986
84.082
+0.376
0.45%
jan 1, 1987
84.457
+0.376
0.45%
jan 1, 1988
84.779
+0.322
0.38%
jan 1, 1989
85.083
+0.304
0.36%
jan 1, 1990
85.262
+0.179
0.21%
jan 1, 1991
85.495
+0.233
0.27%
jan 1, 1992
80.665
-4.829
-5.65%
jan 1, 1993
79.95
-0.715
-0.89%
jan 1, 1994
82.991
+3.041
3.8%
jan 1, 1995
83.169
+0.179
0.22%
jan 1, 1996
83.509
+0.34
0.41%
jan 1, 1997
80.279
-3.231
-3.87%
jan 1, 1998
81.672
+1.393
1.74%
jan 1, 1999
80.504
-1.168
-1.43%
jan 1, 2000
81.452
+0.948
1.18%
jan 1, 2001
79.163
-2.289
-2.81%
jan 1, 2002
79.413
+0.25
0.32%
jan 1, 2003
79.413
0.0
0.0%
jan 1, 2004
79.413
0.0
0.0%
jan 1, 2005
79.325
-0.089
-0.11%
jan 1, 2006
79.378
+0.054
0.07%
jan 1, 2007
79.342
-0.036
-0.05%
jan 1, 2008
79.271
-0.071
-0.09%
jan 1, 2009
79.244
-0.027
-0.03%
jan 1, 2010
79.147
-0.097
-0.12%
jan 1, 2011
78.945
-0.202
-0.26%
jan 1, 2012
76.494
-2.451
-3.1%
jan 1, 2013
76.261
-0.233
-0.31%
jan 1, 2014
76.049
-0.212
-0.28%
jan 1, 2015
75.74
-0.309
-0.41%
jan 1, 2016
75.118
-0.622
-0.82%
Ranking of countries by current statistics by years


Comments: