29
/
en
AIzaSyAYiBZKx7MnpbEhh9jyipgxe19OcubqV5w
April 1, 2024
234006
Sao Tome and Principe
STP
true
2
1
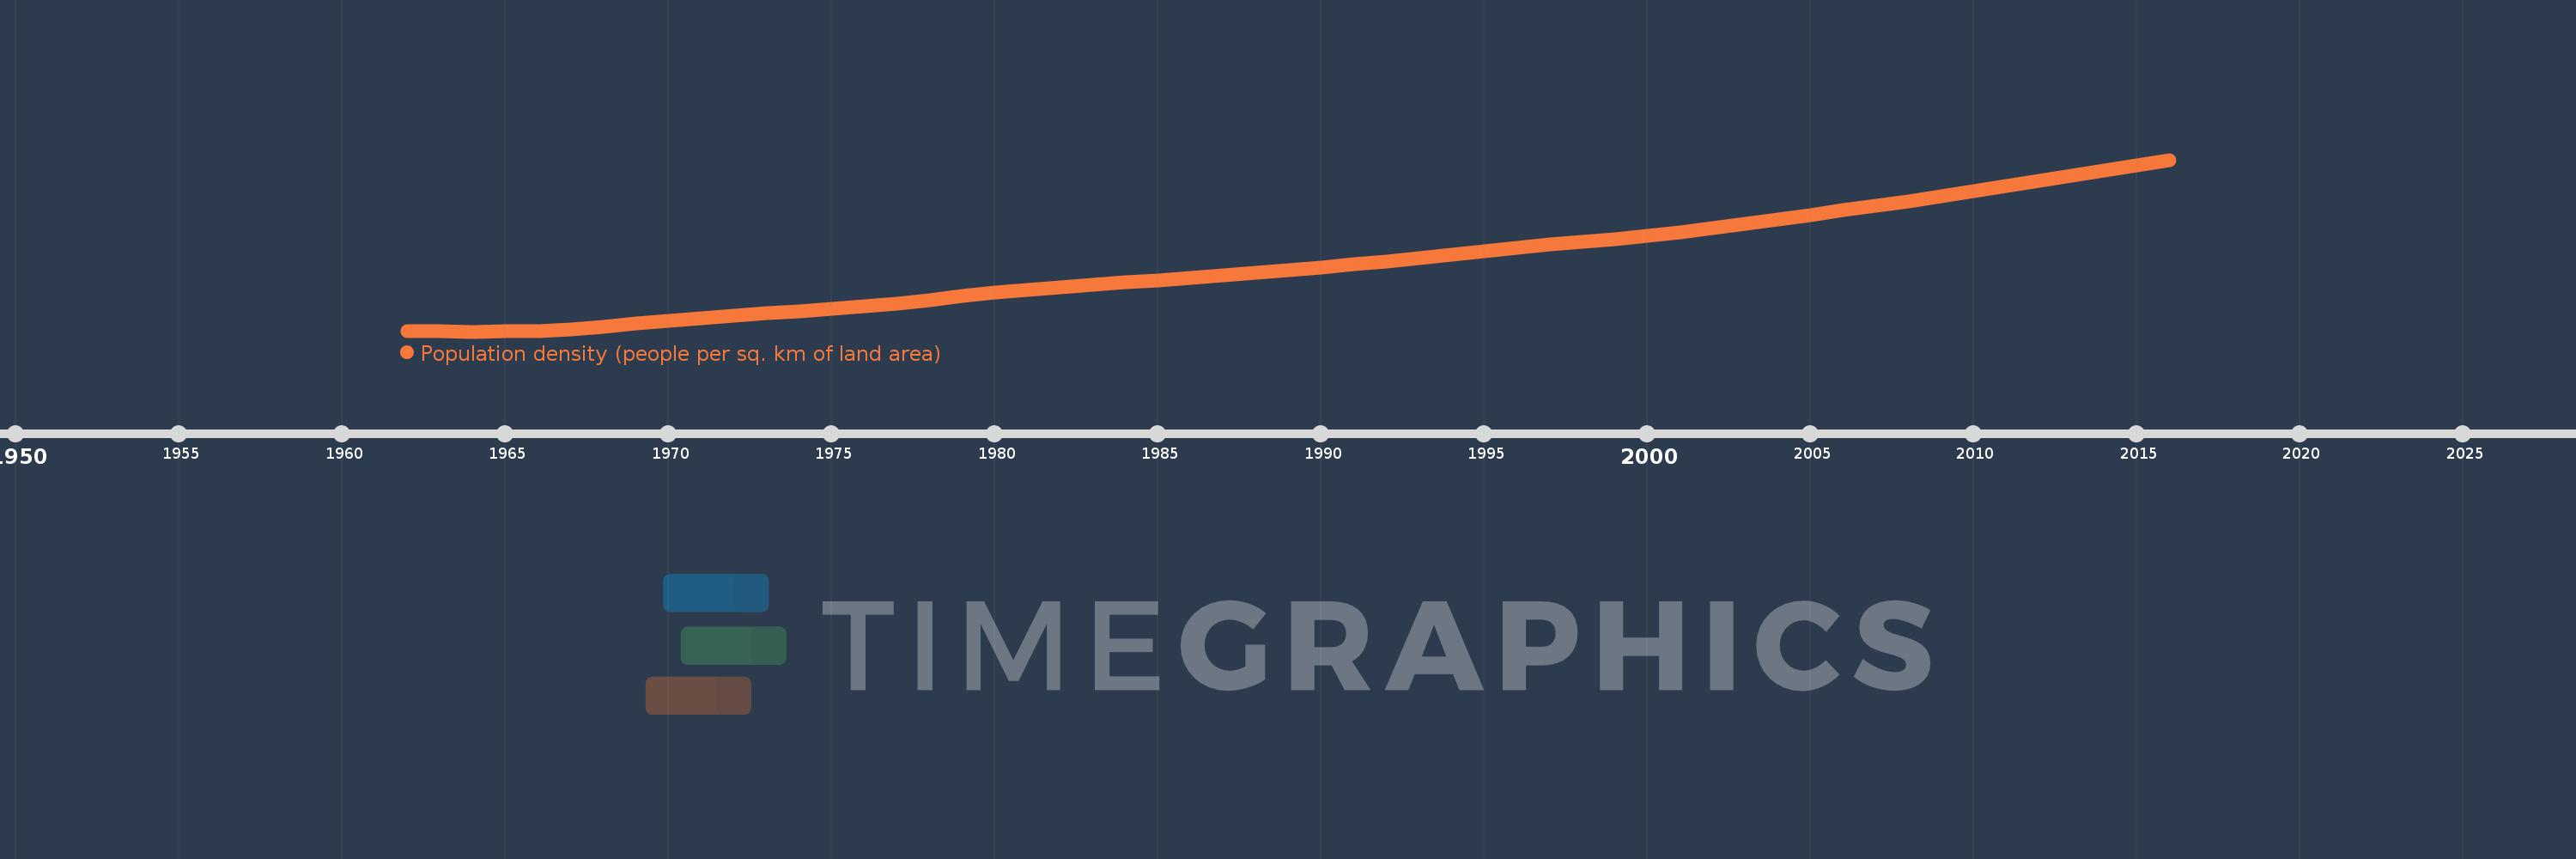
Population density (people per sq. km of land area)
2016,2015,2014,2013,2012,2011,2010,2009,2008,2007,2006,2005,2004,2003,2002,2001,2000,1999,1998,1997,1996,1995,1994,1993,1992,1991,1990,1989,1988,1987,1986,1985,1984,1983,1982,1981,1980,1979,1978,1977,1976,1975,1974,1973,1972,1971,1970,1969,1968,1967,1966,1965,1964,1963,1962
This statistics in other country:
AfghanistanAlbaniaAlgeriaAmerican SamoaAndorraAngolaAntigua and BarbudaArab WorldArgentinaArmeniaArubaAustraliaAustriaAzerbaijanBahamas, TheBahrainBangladeshBarbadosBelarusBelgiumBelizeBeninBermudaBhutanBoliviaBosnia and HerzegovinaBotswanaBrazilBritish Virgin IslandsBrunei DarussalamBulgariaBurkina FasoBurundiCabo VerdeCambodiaCameroonCanadaCaribbean small statesCayman IslandsCentral African RepublicCentral Europe and the BalticsChadChannel IslandsChileChinaColombiaComorosCongo, Dem. Rep.Congo, Rep.Costa RicaCote d'IvoireCroatiaCubaCuracaoCyprusCzech RepublicDenmarkDjiboutiDominicaDominican RepublicEarly-demographic dividendEast Asia & PacificEast Asia & Pacific (excluding high income)East Asia & Pacific (IDA & IBRD countries)EcuadorEgypt, Arab Rep.El SalvadorEquatorial GuineaEritreaEstoniaEthiopiaEuro areaEurope & Central AsiaEurope & Central Asia (excluding high income)Europe & Central Asia (IDA & IBRD countries)European UnionFaroe IslandsFijiFinlandFragile and conflict affected situationsFranceFrench PolynesiaGabonGambia, TheGeorgiaGermanyGhanaGibraltarGreeceGreenlandGrenadaGuamGuatemalaGuineaGuinea-BissauGuyanaHaitiHeavily indebted poor countries (HIPC)High incomeHondurasHong Kong SAR, ChinaHungaryIBRD onlyIcelandIDA & IBRD totalIDA blendIDA onlyIDA totalIndiaIndonesiaIran, Islamic Rep.IraqIrelandIsle of ManIsraelItalyJamaicaJapanJordanKazakhstanKenyaKiribatiKorea, Dem. People’s Rep.Korea, Rep.KosovoKuwaitKyrgyz RepublicLao PDRLate-demographic dividendLatin America & Caribbean Latin America & Caribbean (excluding high income)Latin America & the Caribbean (IDA & IBRD countries)LatviaLeast developed countries: UN classificationLebanonLesothoLiberiaLibyaLiechtensteinLithuaniaLow & middle incomeLow incomeLower middle incomeLuxembourgMacao SAR, ChinaMacedonia, FYRMadagascarMalawiMalaysiaMaldivesMaliMaltaMarshall IslandsMauritaniaMauritiusMexicoMicronesia, Fed. Sts.Middle East & North AfricaMiddle East & North Africa (excluding high income)Middle East & North Africa (IDA & IBRD countries)Middle incomeMoldovaMonacoMongoliaMontenegroMoroccoMozambiqueMyanmarNamibiaNauruNepalNetherlandsNew CaledoniaNew ZealandNicaraguaNigerNigeriaNorth AmericaNorthern Mariana IslandsNorwayOECD membersOmanOther small statesPacific island small statesPakistanPalauPanamaPapua New GuineaParaguayPeruPhilippinesPolandPortugalPost-demographic dividendPre-demographic dividendPuerto RicoQatarRomaniaRussian FederationRwandaSamoaSan MarinoSao Tome and PrincipeSaudi ArabiaSenegalSerbiaSeychellesSierra LeoneSingaporeSint Maarten (Dutch part)Slovak RepublicSloveniaSmall statesSolomon IslandsSomaliaSouth AfricaSouth AsiaSouth Asia (IDA & IBRD)SpainSri LankaSt. Kitts and NevisSt. LuciaSt. Martin (French part)St. Vincent and the GrenadinesSub-Saharan Africa Sub-Saharan Africa (excluding high income)Sub-Saharan Africa (IDA & IBRD countries)SudanSurinameSwazilandSwedenSwitzerlandSyrian Arab RepublicTajikistanTanzaniaThailandTimor-LesteTogoTongaTrinidad and TobagoTunisiaTurkeyTurkmenistanTurks and Caicos IslandsTuvaluUgandaUkraineUnited Arab EmiratesUnited KingdomUnited StatesUpper middle incomeUruguayUzbekistanVanuatuVenezuela, RBVietnamVirgin Islands (U.S.)West Bank and GazaWorldYemen, Rep.ZambiaZimbabwe Timeline:
This timeline shows a graph from 1962 to 2016 of Sao Tome and Principe. No data until 1961. Number of actual observations by date: 55.
Source name:
World Development Indicators
Source organization:
Food and Agriculture Organization and World Bank population estimates.
Categories, topics:
Urban Development
Last updated:
apr 23, 2017
Indicators value changes by year
Minimum:
66.855
jan 1, 1964
Maximum:
198.275
jan 1, 2016
At the date of observation
Value
Absolute change
Change from previous value
jan 1, 1962
67.239
+67.239
0.0%
jan 1, 1963
67.114
-0.125
-0.19%
jan 1, 1964
66.855
-0.258
-0.38%
jan 1, 1965
66.884
+0.029
0.04%
jan 1, 1966
67.497
+0.612
0.92%
jan 1, 1967
68.809
+1.313
1.94%
jan 1, 1968
70.702
+1.893
2.75%
jan 1, 1969
72.958
+2.256
3.19%
jan 1, 1970
75.25
+2.292
3.14%
jan 1, 1971
77.345
+2.095
2.78%
jan 1, 1972
79.155
+1.81
2.34%
jan 1, 1973
80.767
+1.611
2.04%
jan 1, 1974
82.319
+1.552
1.92%
jan 1, 1975
84.031
+1.713
2.08%
jan 1, 1976
86.049
+2.018
2.4%
jan 1, 1977
88.426
+2.377
2.76%
jan 1, 1978
91.079
+2.653
3.0%
jan 1, 1979
93.849
+2.77
3.04%
jan 1, 1980
96.513
+2.664
2.84%
jan 1, 1981
98.909
+2.397
2.48%
jan 1, 1982
100.986
+2.077
2.1%
jan 1, 1983
102.804
+1.818
1.8%
jan 1, 1984
104.464
+1.659
1.61%
jan 1, 1985
106.116
+1.652
1.58%
jan 1, 1986
107.872
+1.756
1.66%
jan 1, 1987
109.754
+1.882
1.74%
jan 1, 1988
111.733
+1.979
1.8%
jan 1, 1989
113.821
+2.088
1.87%
jan 1, 1990
116.014
+2.193
1.93%
jan 1, 1991
118.307
+2.294
1.98%
jan 1, 1992
120.729
+2.422
2.05%
jan 1, 1993
123.277
+2.548
2.11%
jan 1, 1994
125.884
+2.607
2.11%
jan 1, 1995
128.456
+2.572
2.04%
jan 1, 1996
130.931
+2.475
1.93%
jan 1, 1997
133.277
+2.346
1.79%
jan 1, 1998
135.531
+2.254
1.69%
jan 1, 1999
137.796
+2.265
1.67%
jan 1, 2000
140.21
+2.415
1.75%
jan 1, 2001
142.879
+2.669
1.9%
jan 1, 2002
145.836
+2.957
2.07%
jan 1, 2003
149.047
+3.21
2.2%
jan 1, 2004
152.455
+3.408
2.29%
jan 1, 2005
155.971
+3.516
2.31%
jan 1, 2006
159.527
+3.556
2.28%
jan 1, 2007
163.108
+3.581
2.24%
jan 1, 2008
166.733
+3.625
2.22%
jan 1, 2009
170.411
+3.678
2.21%
jan 1, 2010
174.162
+3.751
2.2%
jan 1, 2011
178.0
+3.838
2.2%
jan 1, 2012
181.923
+3.923
2.2%
jan 1, 2013
185.921
+3.998
2.2%
jan 1, 2014
189.985
+4.065
2.19%
jan 1, 2015
194.106
+4.121
2.17%
jan 1, 2016
198.275
+4.169
2.15%
Ranking of countries by current statistics by years


Comments: