29
/
en
AIzaSyAYiBZKx7MnpbEhh9jyipgxe19OcubqV5w
April 1, 2024
51307
Middle income
MIC
false
2
1
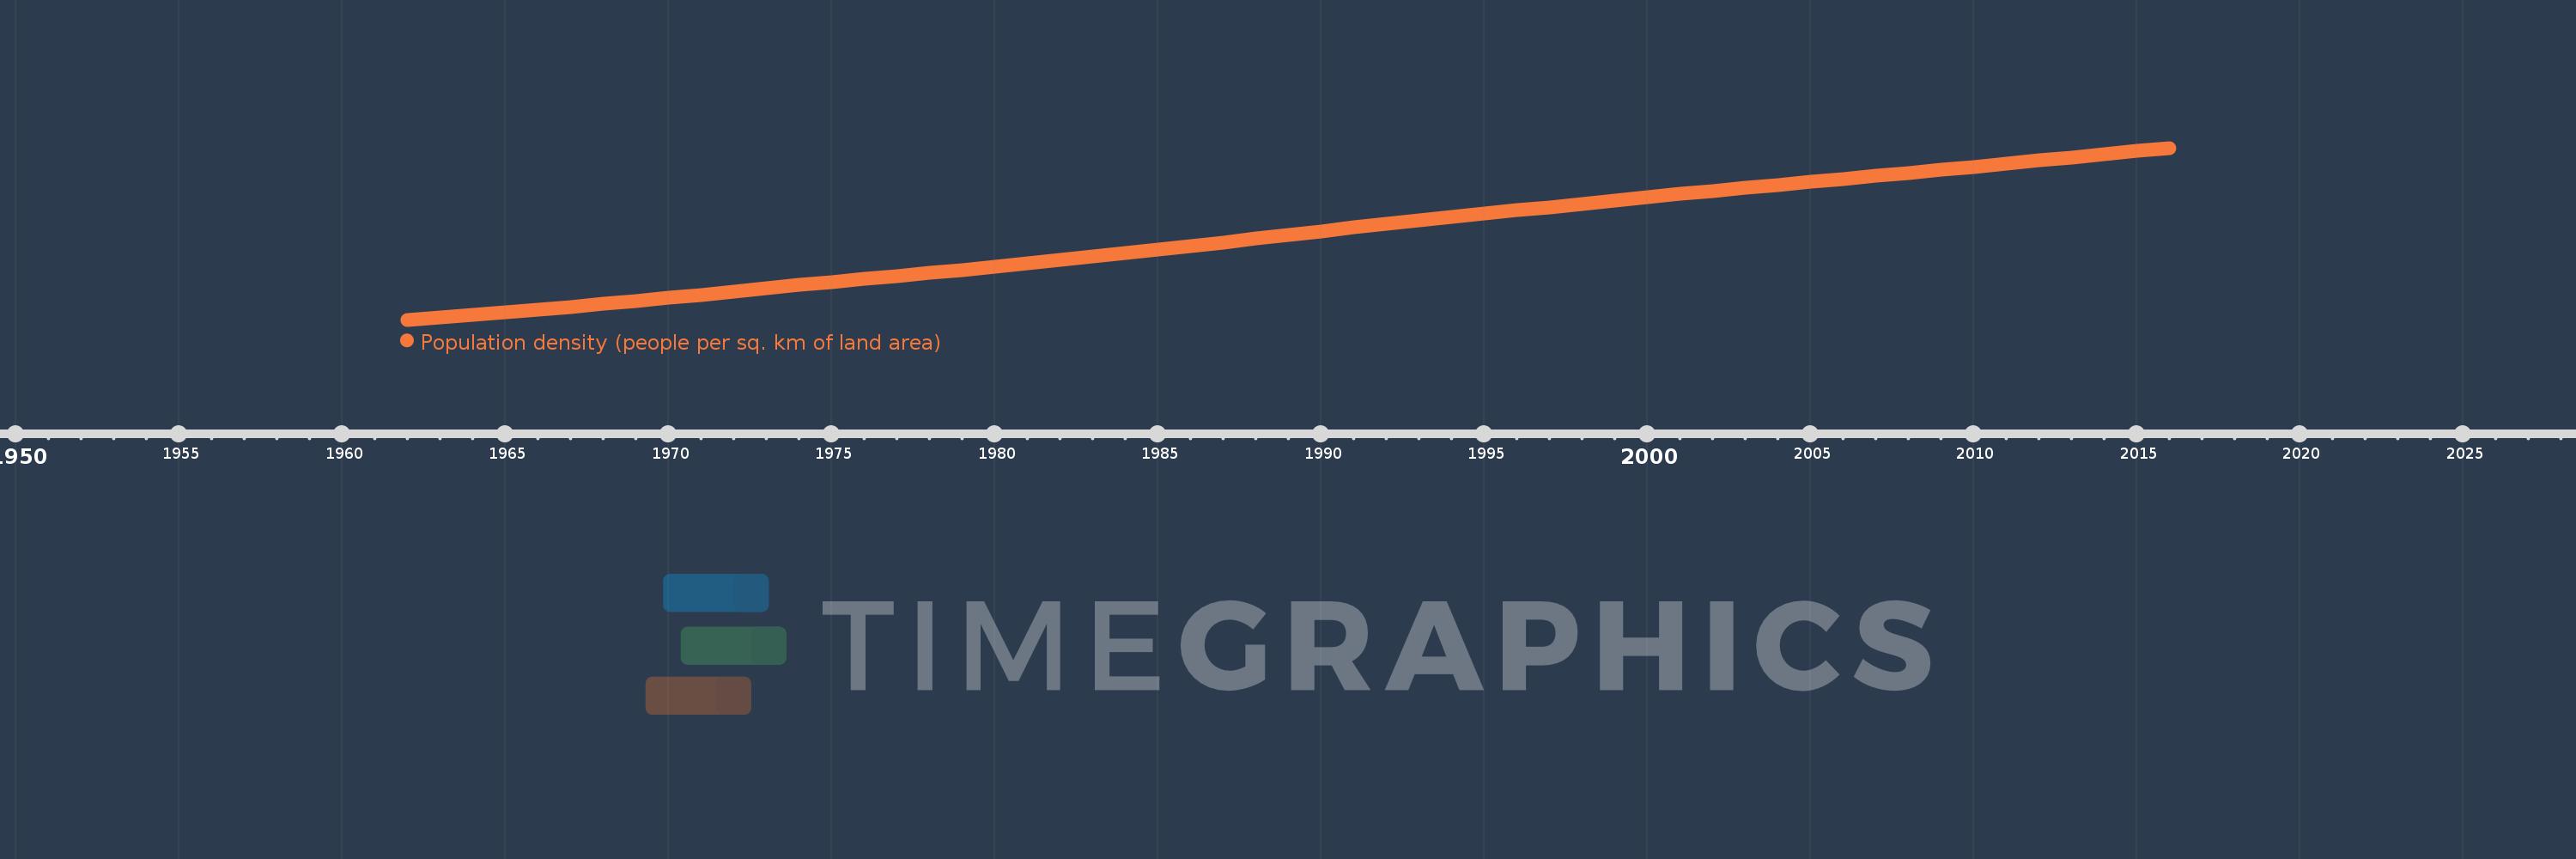
Population density (people per sq. km of land area)
2016,2015,2014,2013,2012,2011,2010,2009,2008,2007,2006,2005,2004,2003,2002,2001,2000,1999,1998,1997,1996,1995,1994,1993,1992,1991,1990,1989,1988,1987,1986,1985,1984,1983,1982,1981,1980,1979,1978,1977,1976,1975,1974,1973,1972,1971,1970,1969,1968,1967,1966,1965,1964,1963,1962
This statistics in other country:
AfghanistanAlbaniaAlgeriaAmerican SamoaAndorraAngolaAntigua and BarbudaArab WorldArgentinaArmeniaArubaAustraliaAustriaAzerbaijanBahamas, TheBahrainBangladeshBarbadosBelarusBelgiumBelizeBeninBermudaBhutanBoliviaBosnia and HerzegovinaBotswanaBrazilBritish Virgin IslandsBrunei DarussalamBulgariaBurkina FasoBurundiCabo VerdeCambodiaCameroonCanadaCaribbean small statesCayman IslandsCentral African RepublicCentral Europe and the BalticsChadChannel IslandsChileChinaColombiaComorosCongo, Dem. Rep.Congo, Rep.Costa RicaCote d'IvoireCroatiaCubaCuracaoCyprusCzech RepublicDenmarkDjiboutiDominicaDominican RepublicEarly-demographic dividendEast Asia & PacificEast Asia & Pacific (excluding high income)East Asia & Pacific (IDA & IBRD countries)EcuadorEgypt, Arab Rep.El SalvadorEquatorial GuineaEritreaEstoniaEthiopiaEuro areaEurope & Central AsiaEurope & Central Asia (excluding high income)Europe & Central Asia (IDA & IBRD countries)European UnionFaroe IslandsFijiFinlandFragile and conflict affected situationsFranceFrench PolynesiaGabonGambia, TheGeorgiaGermanyGhanaGibraltarGreeceGreenlandGrenadaGuamGuatemalaGuineaGuinea-BissauGuyanaHaitiHeavily indebted poor countries (HIPC)High incomeHondurasHong Kong SAR, ChinaHungaryIBRD onlyIcelandIDA & IBRD totalIDA blendIDA onlyIDA totalIndiaIndonesiaIran, Islamic Rep.IraqIrelandIsle of ManIsraelItalyJamaicaJapanJordanKazakhstanKenyaKiribatiKorea, Dem. People’s Rep.Korea, Rep.KosovoKuwaitKyrgyz RepublicLao PDRLate-demographic dividendLatin America & Caribbean Latin America & Caribbean (excluding high income)Latin America & the Caribbean (IDA & IBRD countries)LatviaLeast developed countries: UN classificationLebanonLesothoLiberiaLibyaLiechtensteinLithuaniaLow & middle incomeLow incomeLower middle incomeLuxembourgMacao SAR, ChinaMacedonia, FYRMadagascarMalawiMalaysiaMaldivesMaliMaltaMarshall IslandsMauritaniaMauritiusMexicoMicronesia, Fed. Sts.Middle East & North AfricaMiddle East & North Africa (excluding high income)Middle East & North Africa (IDA & IBRD countries)Middle incomeMoldovaMonacoMongoliaMontenegroMoroccoMozambiqueMyanmarNamibiaNauruNepalNetherlandsNew CaledoniaNew ZealandNicaraguaNigerNigeriaNorth AmericaNorthern Mariana IslandsNorwayOECD membersOmanOther small statesPacific island small statesPakistanPalauPanamaPapua New GuineaParaguayPeruPhilippinesPolandPortugalPost-demographic dividendPre-demographic dividendPuerto RicoQatarRomaniaRussian FederationRwandaSamoaSan MarinoSao Tome and PrincipeSaudi ArabiaSenegalSerbiaSeychellesSierra LeoneSingaporeSint Maarten (Dutch part)Slovak RepublicSloveniaSmall statesSolomon IslandsSomaliaSouth AfricaSouth AsiaSouth Asia (IDA & IBRD)SpainSri LankaSt. Kitts and NevisSt. LuciaSt. Martin (French part)St. Vincent and the GrenadinesSub-Saharan Africa Sub-Saharan Africa (excluding high income)Sub-Saharan Africa (IDA & IBRD countries)SudanSurinameSwazilandSwedenSwitzerlandSyrian Arab RepublicTajikistanTanzaniaThailandTimor-LesteTogoTongaTrinidad and TobagoTunisiaTurkeyTurkmenistanTurks and Caicos IslandsTuvaluUgandaUkraineUnited Arab EmiratesUnited KingdomUnited StatesUpper middle incomeUruguayUzbekistanVanuatuVenezuela, RBVietnamVirgin Islands (U.S.)West Bank and GazaWorldYemen, Rep.ZambiaZimbabwe Timeline:
This timeline shows a graph from 1962 to 2016 of Middle income. No data until 1961. Number of actual observations by date: 55.
Source name:
World Development Indicators
Source organization:
Food and Agriculture Organization and World Bank population estimates.
Categories, topics:
Urban Development
Last updated:
apr 23, 2017
Indicators value changes by year
Minimum:
26.402
jan 1, 1962
Maximum:
67.932
jan 1, 2016
At the date of observation
Value
Absolute change
Change from previous value
jan 1, 1962
26.402
+26.402
0.0%
jan 1, 1963
26.886
+0.484
1.83%
jan 1, 1964
27.517
+0.631
2.35%
jan 1, 1965
28.154
+0.637
2.32%
jan 1, 1966
28.809
+0.655
2.33%
jan 1, 1967
29.508
+0.699
2.43%
jan 1, 1968
30.205
+0.697
2.36%
jan 1, 1969
30.921
+0.716
2.37%
jan 1, 1970
31.666
+0.745
2.41%
jan 1, 1971
32.432
+0.766
2.42%
jan 1, 1972
33.215
+0.783
2.41%
jan 1, 1973
33.986
+0.771
2.32%
jan 1, 1974
34.757
+0.771
2.27%
jan 1, 1975
35.521
+0.764
2.2%
jan 1, 1976
36.268
+0.748
2.1%
jan 1, 1977
37.008
+0.74
2.04%
jan 1, 1978
37.74
+0.732
1.98%
jan 1, 1979
38.484
+0.744
1.97%
jan 1, 1980
39.245
+0.762
1.98%
jan 1, 1981
40.017
+0.772
1.97%
jan 1, 1982
40.809
+0.792
1.98%
jan 1, 1983
41.641
+0.832
2.04%
jan 1, 1984
42.485
+0.844
2.03%
jan 1, 1985
43.327
+0.842
1.98%
jan 1, 1986
44.184
+0.857
1.98%
jan 1, 1987
45.067
+0.883
2.0%
jan 1, 1988
45.973
+0.906
2.01%
jan 1, 1989
46.884
+0.911
1.98%
jan 1, 1990
47.786
+0.902
1.92%
jan 1, 1991
48.69
+0.904
1.89%
jan 1, 1992
49.549
+0.859
1.76%
jan 1, 1993
50.385
+0.836
1.69%
jan 1, 1994
51.208
+0.823
1.63%
jan 1, 1995
52.028
+0.82
1.6%
jan 1, 1996
52.837
+0.809
1.56%
jan 1, 1997
53.642
+0.805
1.52%
jan 1, 1998
54.445
+0.803
1.5%
jan 1, 1999
55.256
+0.811
1.49%
jan 1, 2000
56.027
+0.771
1.4%
jan 1, 2001
56.805
+0.778
1.39%
jan 1, 2002
57.55
+0.745
1.31%
jan 1, 2003
58.285
+0.735
1.28%
jan 1, 2004
59.017
+0.731
1.25%
jan 1, 2005
59.747
+0.73
1.24%
jan 1, 2006
60.476
+0.729
1.22%
jan 1, 2007
61.204
+0.728
1.2%
jan 1, 2008
61.925
+0.722
1.18%
jan 1, 2009
62.652
+0.727
1.17%
jan 1, 2010
63.389
+0.737
1.18%
jan 1, 2011
64.13
+0.741
1.17%
jan 1, 2012
64.879
+0.748
1.17%
jan 1, 2013
65.634
+0.755
1.16%
jan 1, 2014
66.398
+0.764
1.16%
jan 1, 2015
67.165
+0.767
1.15%
jan 1, 2016
67.932
+0.767
1.14%
Ranking of countries by current statistics by years


Comments: