29
/
en
AIzaSyAYiBZKx7MnpbEhh9jyipgxe19OcubqV5w
April 1, 2024
156506
Indonesia
IDN
true
2
1
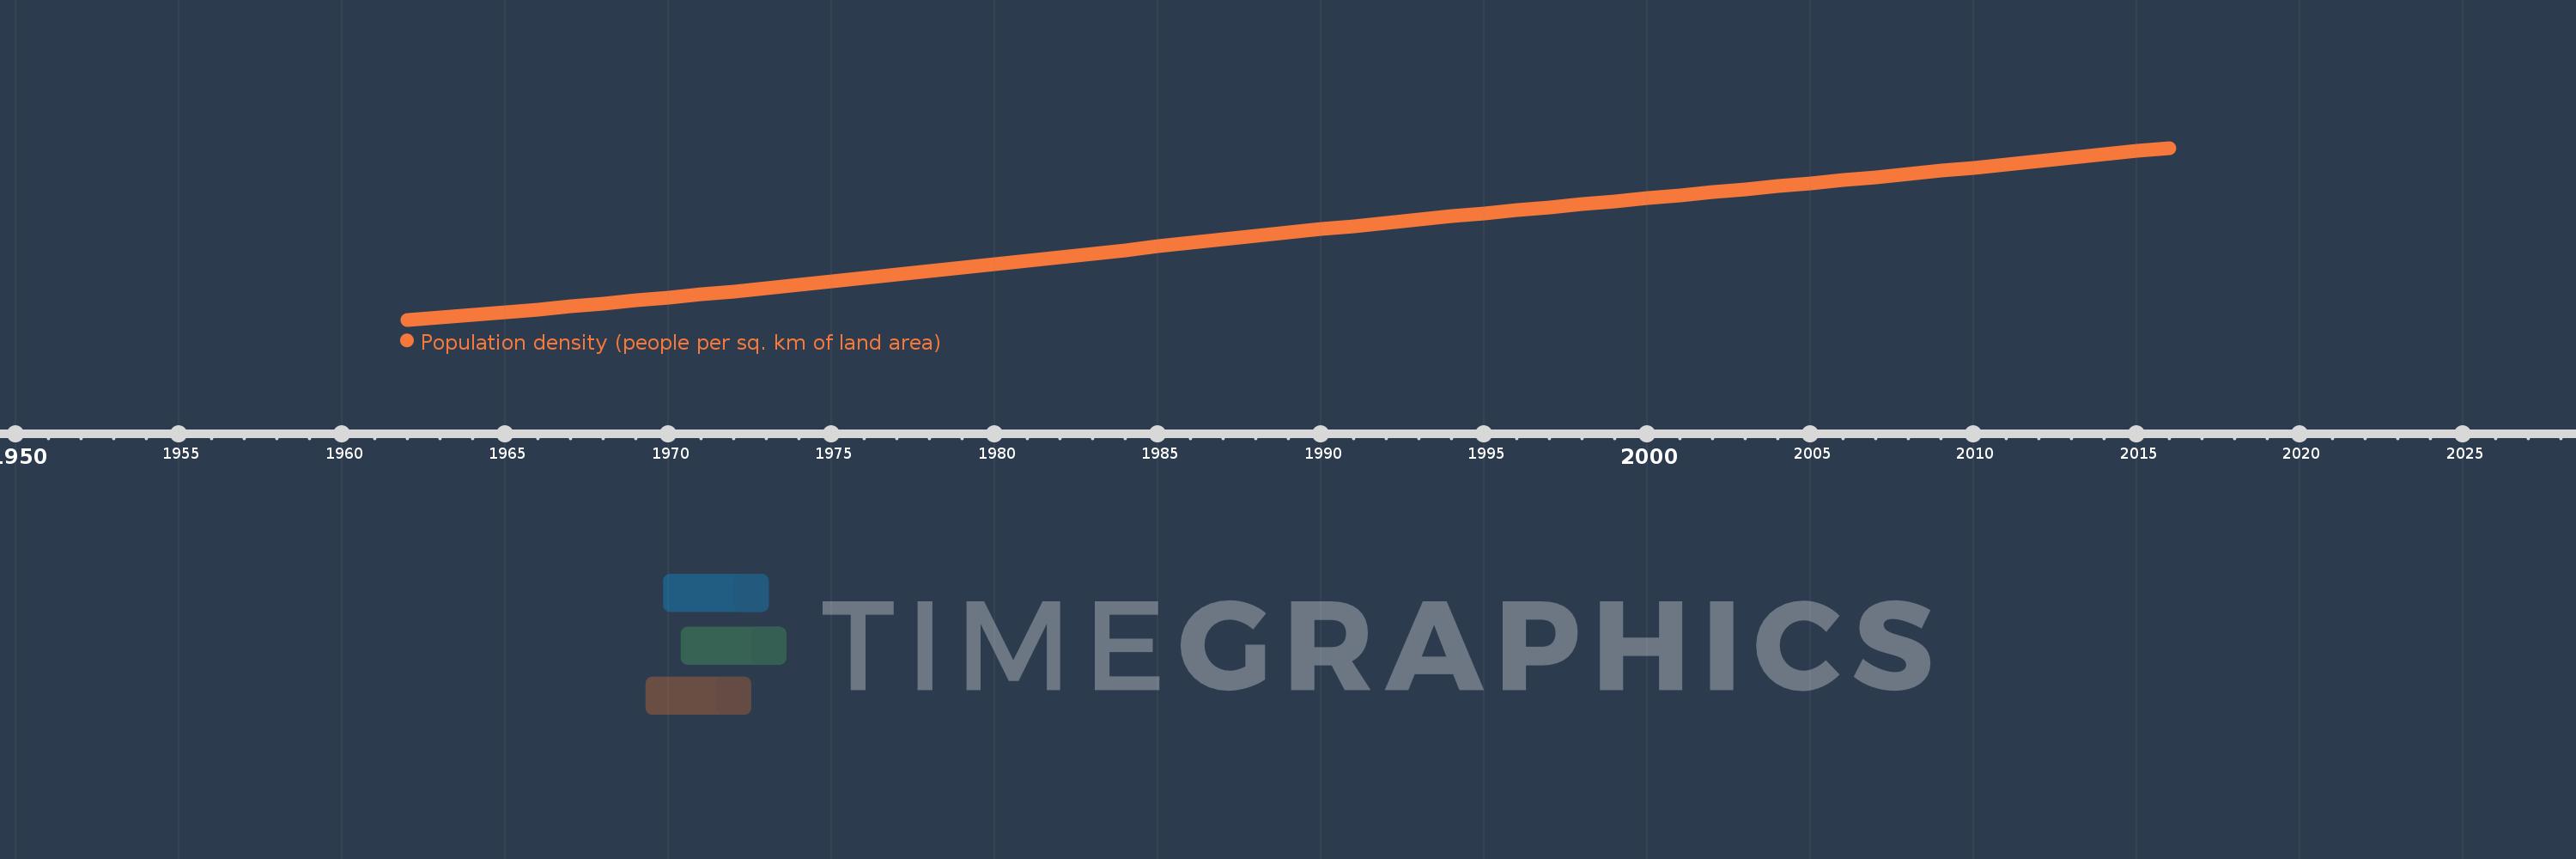
Population density (people per sq. km of land area)
2016,2015,2014,2013,2012,2011,2010,2009,2008,2007,2006,2005,2004,2003,2002,2001,2000,1999,1998,1997,1996,1995,1994,1993,1992,1991,1990,1989,1988,1987,1986,1985,1984,1983,1982,1981,1980,1979,1978,1977,1976,1975,1974,1973,1972,1971,1970,1969,1968,1967,1966,1965,1964,1963,1962
This statistics in other country:
AfghanistanAlbaniaAlgeriaAmerican SamoaAndorraAngolaAntigua and BarbudaArab WorldArgentinaArmeniaArubaAustraliaAustriaAzerbaijanBahamas, TheBahrainBangladeshBarbadosBelarusBelgiumBelizeBeninBermudaBhutanBoliviaBosnia and HerzegovinaBotswanaBrazilBritish Virgin IslandsBrunei DarussalamBulgariaBurkina FasoBurundiCabo VerdeCambodiaCameroonCanadaCaribbean small statesCayman IslandsCentral African RepublicCentral Europe and the BalticsChadChannel IslandsChileChinaColombiaComorosCongo, Dem. Rep.Congo, Rep.Costa RicaCote d'IvoireCroatiaCubaCuracaoCyprusCzech RepublicDenmarkDjiboutiDominicaDominican RepublicEarly-demographic dividendEast Asia & PacificEast Asia & Pacific (excluding high income)East Asia & Pacific (IDA & IBRD countries)EcuadorEgypt, Arab Rep.El SalvadorEquatorial GuineaEritreaEstoniaEthiopiaEuro areaEurope & Central AsiaEurope & Central Asia (excluding high income)Europe & Central Asia (IDA & IBRD countries)European UnionFaroe IslandsFijiFinlandFragile and conflict affected situationsFranceFrench PolynesiaGabonGambia, TheGeorgiaGermanyGhanaGibraltarGreeceGreenlandGrenadaGuamGuatemalaGuineaGuinea-BissauGuyanaHaitiHeavily indebted poor countries (HIPC)High incomeHondurasHong Kong SAR, ChinaHungaryIBRD onlyIcelandIDA & IBRD totalIDA blendIDA onlyIDA totalIndiaIndonesiaIran, Islamic Rep.IraqIrelandIsle of ManIsraelItalyJamaicaJapanJordanKazakhstanKenyaKiribatiKorea, Dem. People’s Rep.Korea, Rep.KosovoKuwaitKyrgyz RepublicLao PDRLate-demographic dividendLatin America & Caribbean Latin America & Caribbean (excluding high income)Latin America & the Caribbean (IDA & IBRD countries)LatviaLeast developed countries: UN classificationLebanonLesothoLiberiaLibyaLiechtensteinLithuaniaLow & middle incomeLow incomeLower middle incomeLuxembourgMacao SAR, ChinaMacedonia, FYRMadagascarMalawiMalaysiaMaldivesMaliMaltaMarshall IslandsMauritaniaMauritiusMexicoMicronesia, Fed. Sts.Middle East & North AfricaMiddle East & North Africa (excluding high income)Middle East & North Africa (IDA & IBRD countries)Middle incomeMoldovaMonacoMongoliaMontenegroMoroccoMozambiqueMyanmarNamibiaNauruNepalNetherlandsNew CaledoniaNew ZealandNicaraguaNigerNigeriaNorth AmericaNorthern Mariana IslandsNorwayOECD membersOmanOther small statesPacific island small statesPakistanPalauPanamaPapua New GuineaParaguayPeruPhilippinesPolandPortugalPost-demographic dividendPre-demographic dividendPuerto RicoQatarRomaniaRussian FederationRwandaSamoaSan MarinoSao Tome and PrincipeSaudi ArabiaSenegalSerbiaSeychellesSierra LeoneSingaporeSint Maarten (Dutch part)Slovak RepublicSloveniaSmall statesSolomon IslandsSomaliaSouth AfricaSouth AsiaSouth Asia (IDA & IBRD)SpainSri LankaSt. Kitts and NevisSt. LuciaSt. Martin (French part)St. Vincent and the GrenadinesSub-Saharan Africa Sub-Saharan Africa (excluding high income)Sub-Saharan Africa (IDA & IBRD countries)SudanSurinameSwazilandSwedenSwitzerlandSyrian Arab RepublicTajikistanTanzaniaThailandTimor-LesteTogoTongaTrinidad and TobagoTunisiaTurkeyTurkmenistanTurks and Caicos IslandsTuvaluUgandaUkraineUnited Arab EmiratesUnited KingdomUnited StatesUpper middle incomeUruguayUzbekistanVanuatuVenezuela, RBVietnamVirgin Islands (U.S.)West Bank and GazaWorldYemen, Rep.ZambiaZimbabwe Timeline:
This timeline shows a graph from 1962 to 2016 of Indonesia. No data until 1961. Number of actual observations by date: 55.
Source name:
World Development Indicators
Source organization:
Food and Agriculture Organization and World Bank population estimates.
Categories, topics:
Urban Development
Last updated:
apr 23, 2017
Indicators value changes by year
Minimum:
49.757
jan 1, 1962
Maximum:
142.177
jan 1, 2016
At the date of observation
Value
Absolute change
Change from previous value
jan 1, 1962
49.757
+49.757
0.0%
jan 1, 1963
51.093
+1.336
2.68%
jan 1, 1964
52.471
+1.379
2.7%
jan 1, 1965
53.897
+1.425
2.72%
jan 1, 1966
55.371
+1.474
2.74%
jan 1, 1967
56.894
+1.523
2.75%
jan 1, 1968
58.462
+1.568
2.76%
jan 1, 1969
60.07
+1.609
2.75%
jan 1, 1970
61.714
+1.644
2.74%
jan 1, 1971
63.39
+1.675
2.71%
jan 1, 1972
65.094
+1.704
2.69%
jan 1, 1973
66.826
+1.732
2.66%
jan 1, 1974
68.583
+1.757
2.63%
jan 1, 1975
70.362
+1.779
2.59%
jan 1, 1976
72.161
+1.799
2.56%
jan 1, 1977
73.975
+1.814
2.51%
jan 1, 1978
75.803
+1.828
2.47%
jan 1, 1979
77.649
+1.846
2.43%
jan 1, 1980
79.519
+1.87
2.41%
jan 1, 1981
81.416
+1.897
2.39%
jan 1, 1982
83.341
+1.926
2.37%
jan 1, 1983
85.289
+1.947
2.34%
jan 1, 1984
87.242
+1.953
2.29%
jan 1, 1985
89.18
+1.938
2.22%
jan 1, 1986
91.088
+1.908
2.14%
jan 1, 1987
92.959
+1.871
2.05%
jan 1, 1988
94.796
+1.836
1.98%
jan 1, 1989
96.602
+1.806
1.91%
jan 1, 1990
98.386
+1.784
1.85%
jan 1, 1991
100.154
+1.768
1.8%
jan 1, 1992
101.909
+1.754
1.75%
jan 1, 1993
103.646
+1.737
1.7%
jan 1, 1994
105.363
+1.717
1.66%
jan 1, 1995
107.056
+1.693
1.61%
jan 1, 1996
108.722
+1.666
1.56%
jan 1, 1997
110.361
+1.639
1.51%
jan 1, 1998
111.977
+1.616
1.46%
jan 1, 1999
113.577
+1.601
1.43%
jan 1, 2000
115.173
+1.596
1.4%
jan 1, 2001
116.772
+1.599
1.39%
jan 1, 2002
118.377
+1.605
1.37%
jan 1, 2003
119.989
+1.612
1.36%
jan 1, 2004
121.612
+1.622
1.35%
jan 1, 2005
123.246
+1.634
1.34%
jan 1, 2006
124.894
+1.648
1.34%
jan 1, 2007
126.555
+1.661
1.33%
jan 1, 2008
128.23
+1.674
1.32%
jan 1, 2009
129.921
+1.691
1.32%
jan 1, 2010
131.635
+1.714
1.32%
jan 1, 2011
133.372
+1.738
1.32%
jan 1, 2012
135.136
+1.764
1.32%
jan 1, 2013
136.919
+1.783
1.32%
jan 1, 2014
138.702
+1.783
1.3%
jan 1, 2015
140.461
+1.759
1.27%
jan 1, 2016
142.177
+1.716
1.22%
Ranking of countries by current statistics by years


Comments: