29
/
en
AIzaSyAYiBZKx7MnpbEhh9jyipgxe19OcubqV5w
April 1, 2024
213454
Nigeria
NGA
true
2
1
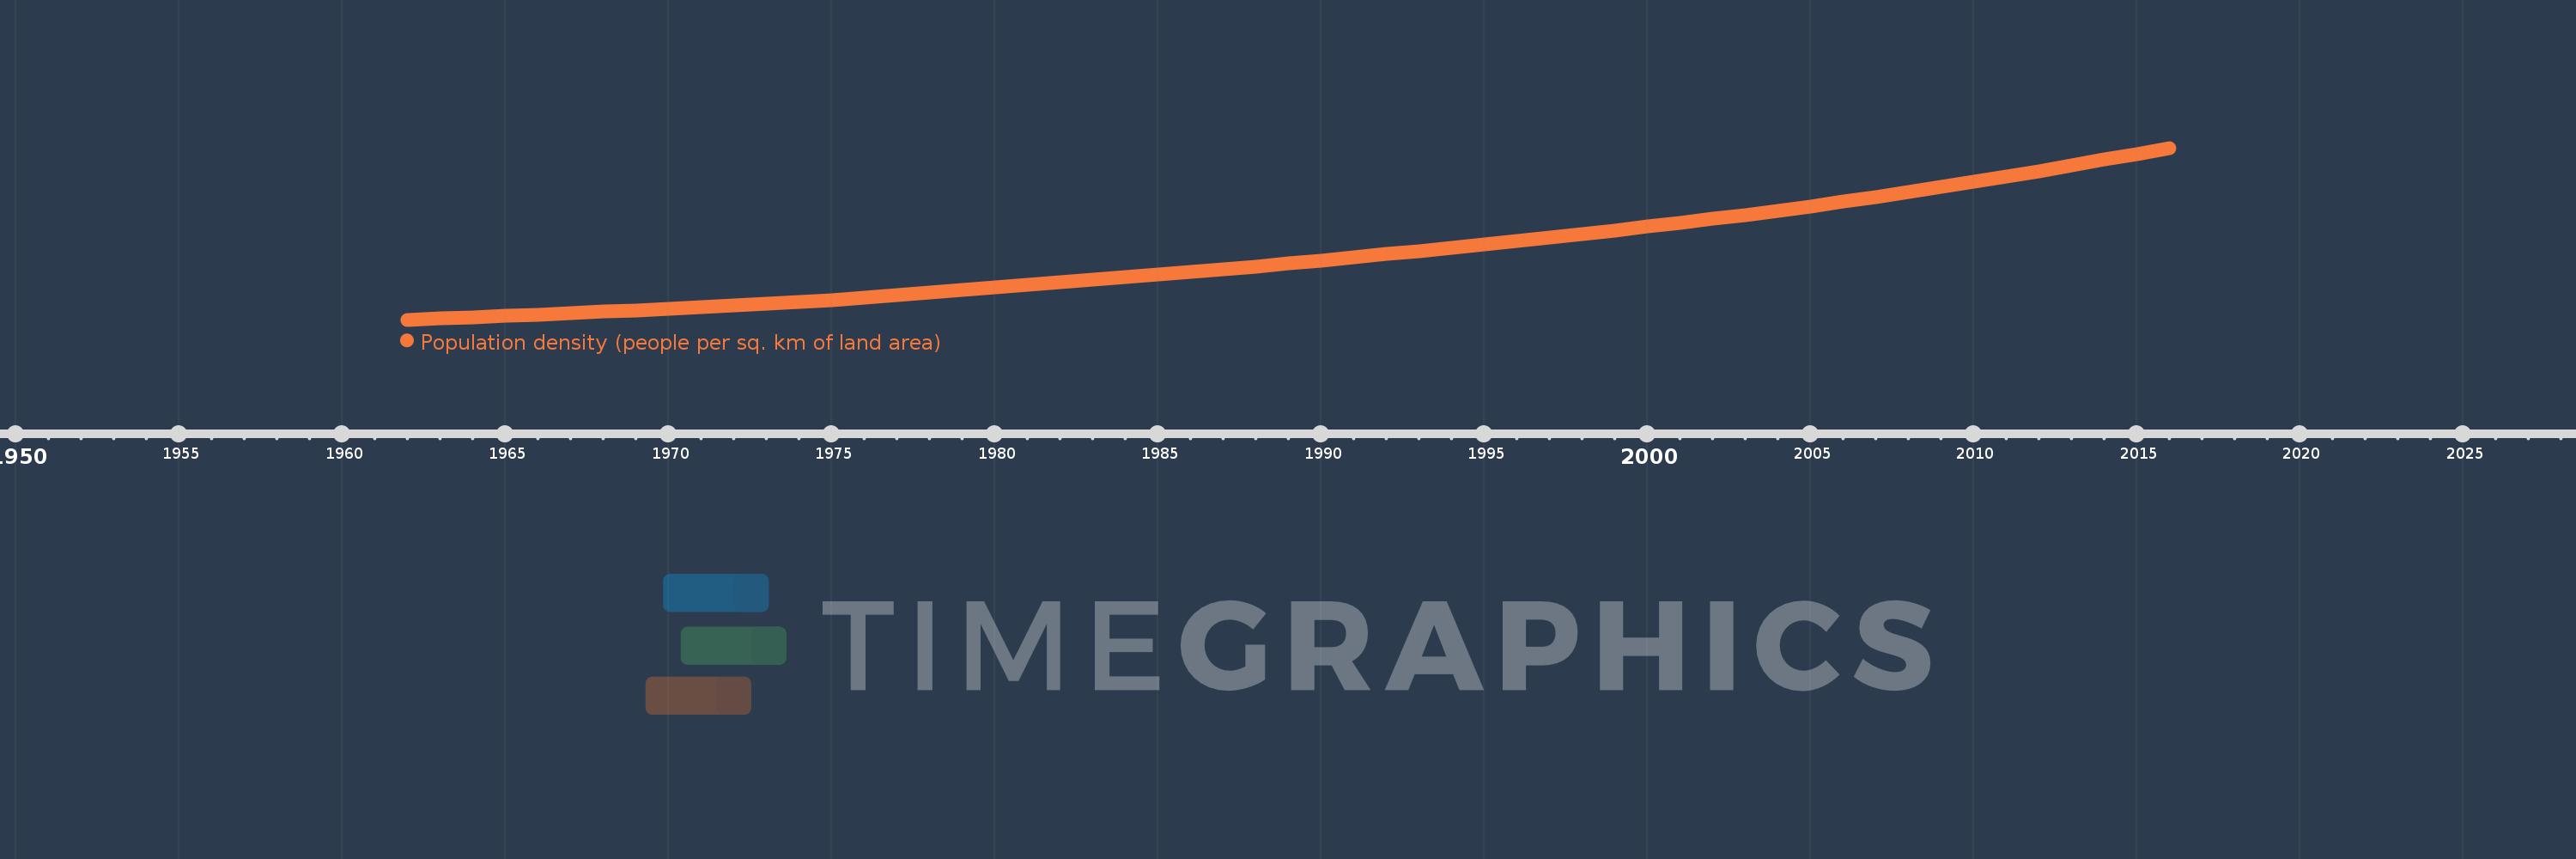
Population density (people per sq. km of land area)
2016,2015,2014,2013,2012,2011,2010,2009,2008,2007,2006,2005,2004,2003,2002,2001,2000,1999,1998,1997,1996,1995,1994,1993,1992,1991,1990,1989,1988,1987,1986,1985,1984,1983,1982,1981,1980,1979,1978,1977,1976,1975,1974,1973,1972,1971,1970,1969,1968,1967,1966,1965,1964,1963,1962
This statistics in other country:
AfghanistanAlbaniaAlgeriaAmerican SamoaAndorraAngolaAntigua and BarbudaArab WorldArgentinaArmeniaArubaAustraliaAustriaAzerbaijanBahamas, TheBahrainBangladeshBarbadosBelarusBelgiumBelizeBeninBermudaBhutanBoliviaBosnia and HerzegovinaBotswanaBrazilBritish Virgin IslandsBrunei DarussalamBulgariaBurkina FasoBurundiCabo VerdeCambodiaCameroonCanadaCaribbean small statesCayman IslandsCentral African RepublicCentral Europe and the BalticsChadChannel IslandsChileChinaColombiaComorosCongo, Dem. Rep.Congo, Rep.Costa RicaCote d'IvoireCroatiaCubaCuracaoCyprusCzech RepublicDenmarkDjiboutiDominicaDominican RepublicEarly-demographic dividendEast Asia & PacificEast Asia & Pacific (excluding high income)East Asia & Pacific (IDA & IBRD countries)EcuadorEgypt, Arab Rep.El SalvadorEquatorial GuineaEritreaEstoniaEthiopiaEuro areaEurope & Central AsiaEurope & Central Asia (excluding high income)Europe & Central Asia (IDA & IBRD countries)European UnionFaroe IslandsFijiFinlandFragile and conflict affected situationsFranceFrench PolynesiaGabonGambia, TheGeorgiaGermanyGhanaGibraltarGreeceGreenlandGrenadaGuamGuatemalaGuineaGuinea-BissauGuyanaHaitiHeavily indebted poor countries (HIPC)High incomeHondurasHong Kong SAR, ChinaHungaryIBRD onlyIcelandIDA & IBRD totalIDA blendIDA onlyIDA totalIndiaIndonesiaIran, Islamic Rep.IraqIrelandIsle of ManIsraelItalyJamaicaJapanJordanKazakhstanKenyaKiribatiKorea, Dem. People’s Rep.Korea, Rep.KosovoKuwaitKyrgyz RepublicLao PDRLate-demographic dividendLatin America & Caribbean Latin America & Caribbean (excluding high income)Latin America & the Caribbean (IDA & IBRD countries)LatviaLeast developed countries: UN classificationLebanonLesothoLiberiaLibyaLiechtensteinLithuaniaLow & middle incomeLow incomeLower middle incomeLuxembourgMacao SAR, ChinaMacedonia, FYRMadagascarMalawiMalaysiaMaldivesMaliMaltaMarshall IslandsMauritaniaMauritiusMexicoMicronesia, Fed. Sts.Middle East & North AfricaMiddle East & North Africa (excluding high income)Middle East & North Africa (IDA & IBRD countries)Middle incomeMoldovaMonacoMongoliaMontenegroMoroccoMozambiqueMyanmarNamibiaNauruNepalNetherlandsNew CaledoniaNew ZealandNicaraguaNigerNigeriaNorth AmericaNorthern Mariana IslandsNorwayOECD membersOmanOther small statesPacific island small statesPakistanPalauPanamaPapua New GuineaParaguayPeruPhilippinesPolandPortugalPost-demographic dividendPre-demographic dividendPuerto RicoQatarRomaniaRussian FederationRwandaSamoaSan MarinoSao Tome and PrincipeSaudi ArabiaSenegalSerbiaSeychellesSierra LeoneSingaporeSint Maarten (Dutch part)Slovak RepublicSloveniaSmall statesSolomon IslandsSomaliaSouth AfricaSouth AsiaSouth Asia (IDA & IBRD)SpainSri LankaSt. Kitts and NevisSt. LuciaSt. Martin (French part)St. Vincent and the GrenadinesSub-Saharan Africa Sub-Saharan Africa (excluding high income)Sub-Saharan Africa (IDA & IBRD countries)SudanSurinameSwazilandSwedenSwitzerlandSyrian Arab RepublicTajikistanTanzaniaThailandTimor-LesteTogoTongaTrinidad and TobagoTunisiaTurkeyTurkmenistanTurks and Caicos IslandsTuvaluUgandaUkraineUnited Arab EmiratesUnited KingdomUnited StatesUpper middle incomeUruguayUzbekistanVanuatuVenezuela, RBVietnamVirgin Islands (U.S.)West Bank and GazaWorldYemen, Rep.ZambiaZimbabwe Timeline:
This timeline shows a graph from 1962 to 2016 of Nigeria. No data until 1961. Number of actual observations by date: 55.
Source name:
World Development Indicators
Source organization:
Food and Agriculture Organization and World Bank population estimates.
Categories, topics:
Urban Development
Last updated:
apr 23, 2017
Indicators value changes by year
Minimum:
50.665
jan 1, 1962
Maximum:
200.053
jan 1, 2016
At the date of observation
Value
Absolute change
Change from previous value
jan 1, 1962
50.665
+50.665
0.0%
jan 1, 1963
51.734
+1.069
2.11%
jan 1, 1964
52.844
+1.11
2.14%
jan 1, 1965
53.987
+1.143
2.16%
jan 1, 1966
55.161
+1.173
2.17%
jan 1, 1967
56.366
+1.205
2.19%
jan 1, 1968
57.609
+1.243
2.21%
jan 1, 1969
58.896
+1.287
2.23%
jan 1, 1970
60.234
+1.338
2.27%
jan 1, 1971
61.631
+1.397
2.32%
jan 1, 1972
63.083
+1.451
2.35%
jan 1, 1973
64.593
+1.51
2.39%
jan 1, 1974
66.192
+1.599
2.48%
jan 1, 1975
67.917
+1.726
2.61%
jan 1, 1976
69.793
+1.876
2.76%
jan 1, 1977
71.837
+2.044
2.93%
jan 1, 1978
74.031
+2.194
3.05%
jan 1, 1979
76.322
+2.291
3.09%
jan 1, 1980
78.636
+2.313
3.03%
jan 1, 1981
80.918
+2.283
2.9%
jan 1, 1982
83.149
+2.231
2.76%
jan 1, 1983
85.345
+2.196
2.64%
jan 1, 1984
87.541
+2.195
2.57%
jan 1, 1985
89.787
+2.246
2.57%
jan 1, 1986
92.122
+2.335
2.6%
jan 1, 1987
94.555
+2.434
2.64%
jan 1, 1988
97.075
+2.52
2.66%
jan 1, 1989
99.667
+2.592
2.67%
jan 1, 1990
102.309
+2.642
2.65%
jan 1, 1991
104.985
+2.676
2.62%
jan 1, 1992
107.695
+2.71
2.58%
jan 1, 1993
110.448
+2.753
2.56%
jan 1, 1994
113.25
+2.803
2.54%
jan 1, 1995
116.114
+2.864
2.53%
jan 1, 1996
119.047
+2.933
2.53%
jan 1, 1997
122.056
+3.008
2.53%
jan 1, 1998
125.141
+3.086
2.53%
jan 1, 1999
128.31
+3.168
2.53%
jan 1, 2000
131.566
+3.256
2.54%
jan 1, 2001
134.915
+3.349
2.55%
jan 1, 2002
138.361
+3.446
2.55%
jan 1, 2003
141.909
+3.548
2.56%
jan 1, 2004
145.571
+3.662
2.58%
jan 1, 2005
149.361
+3.79
2.6%
jan 1, 2006
153.289
+3.929
2.63%
jan 1, 2007
157.359
+4.07
2.66%
jan 1, 2008
161.569
+4.21
2.68%
jan 1, 2009
165.921
+4.351
2.69%
jan 1, 2010
170.413
+4.492
2.71%
jan 1, 2011
175.044
+4.631
2.72%
jan 1, 2012
179.816
+4.772
2.73%
jan 1, 2013
184.723
+4.908
2.73%
jan 1, 2014
189.748
+5.024
2.72%
jan 1, 2015
194.864
+5.116
2.7%
jan 1, 2016
200.053
+5.189
2.66%
Ranking of countries by current statistics by years


Comments: