29
/
en
AIzaSyAYiBZKx7MnpbEhh9jyipgxe19OcubqV5w
April 1, 2024
180666
Liechtenstein
LIE
true
2
1
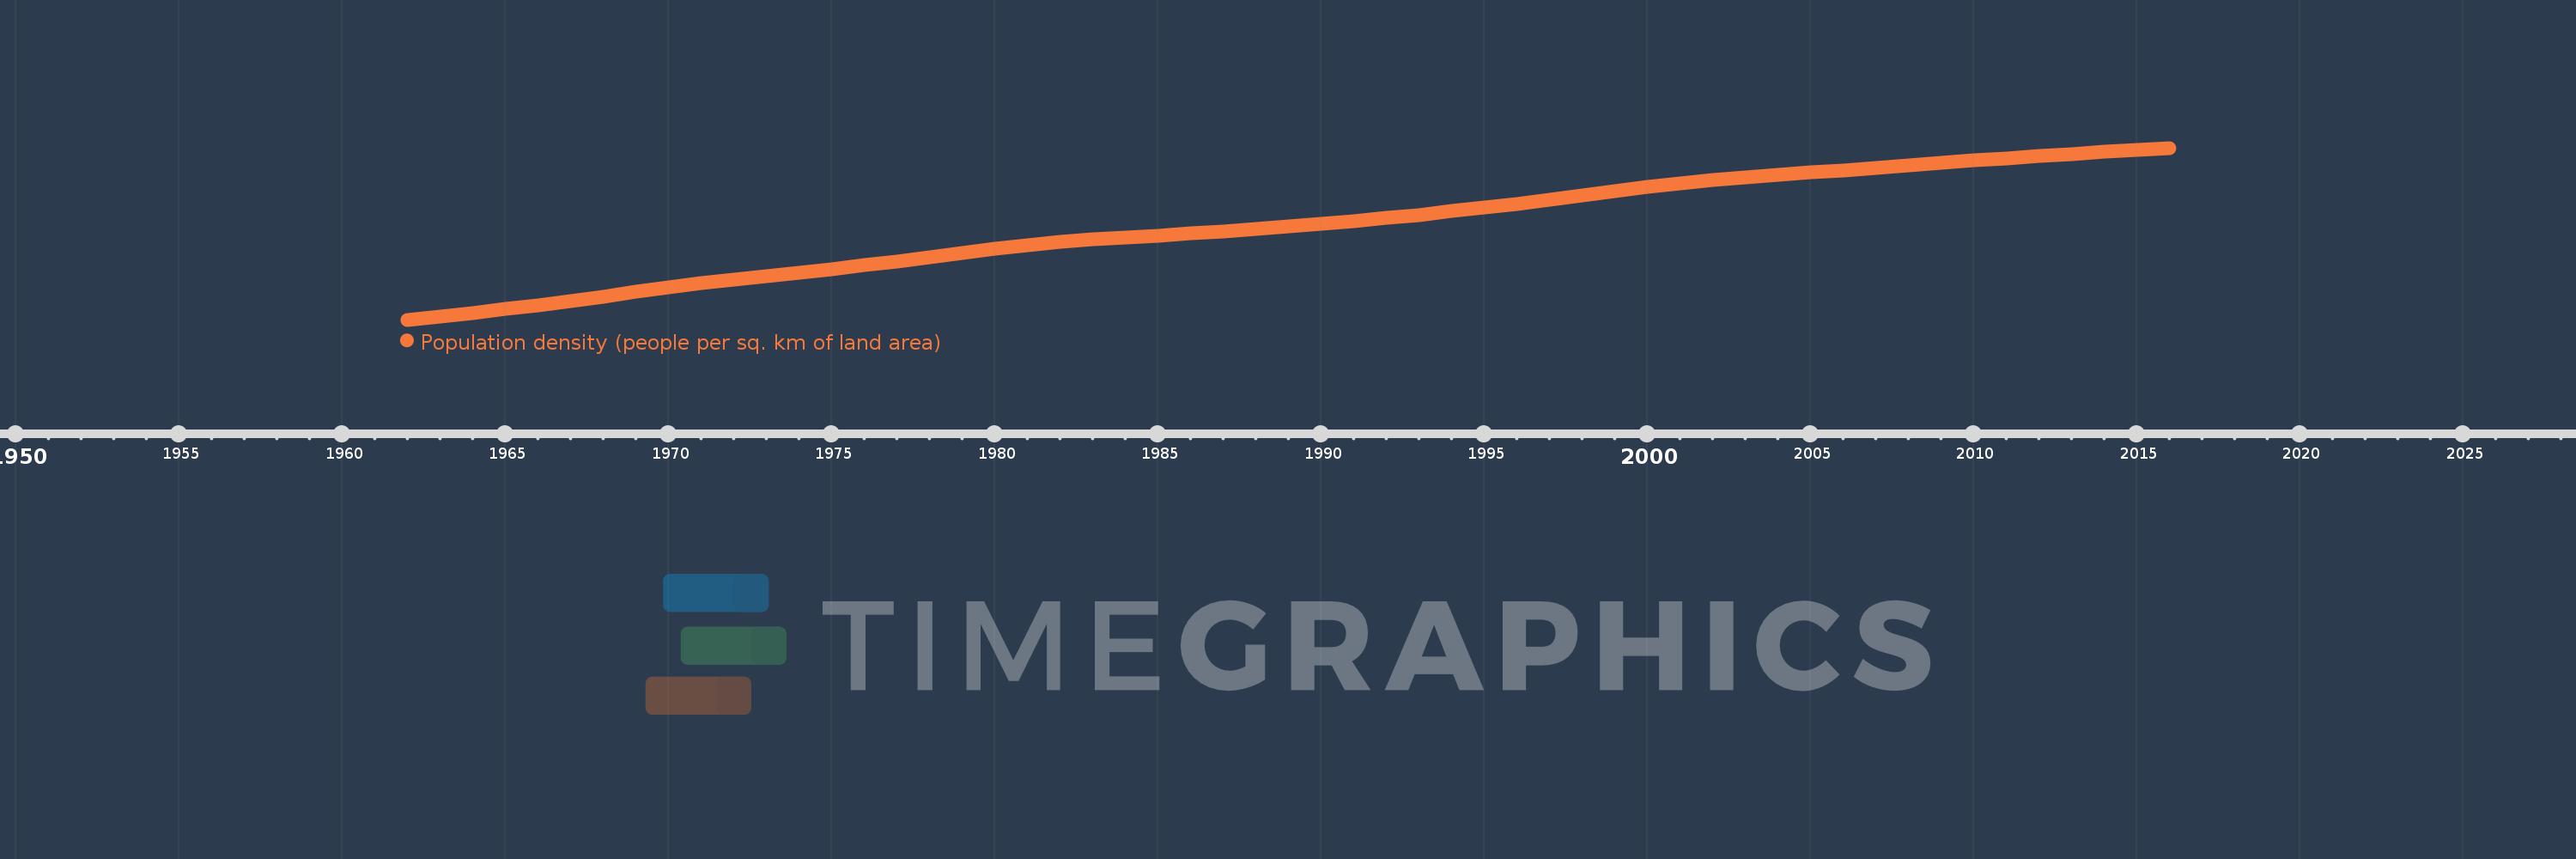
Population density (people per sq. km of land area)
2016,2015,2014,2013,2012,2011,2010,2009,2008,2007,2006,2005,2004,2003,2002,2001,2000,1999,1998,1997,1996,1995,1994,1993,1992,1991,1990,1989,1988,1987,1986,1985,1984,1983,1982,1981,1980,1979,1978,1977,1976,1975,1974,1973,1972,1971,1970,1969,1968,1967,1966,1965,1964,1963,1962
This statistics in other country:
AfghanistanAlbaniaAlgeriaAmerican SamoaAndorraAngolaAntigua and BarbudaArab WorldArgentinaArmeniaArubaAustraliaAustriaAzerbaijanBahamas, TheBahrainBangladeshBarbadosBelarusBelgiumBelizeBeninBermudaBhutanBoliviaBosnia and HerzegovinaBotswanaBrazilBritish Virgin IslandsBrunei DarussalamBulgariaBurkina FasoBurundiCabo VerdeCambodiaCameroonCanadaCaribbean small statesCayman IslandsCentral African RepublicCentral Europe and the BalticsChadChannel IslandsChileChinaColombiaComorosCongo, Dem. Rep.Congo, Rep.Costa RicaCote d'IvoireCroatiaCubaCuracaoCyprusCzech RepublicDenmarkDjiboutiDominicaDominican RepublicEarly-demographic dividendEast Asia & PacificEast Asia & Pacific (excluding high income)East Asia & Pacific (IDA & IBRD countries)EcuadorEgypt, Arab Rep.El SalvadorEquatorial GuineaEritreaEstoniaEthiopiaEuro areaEurope & Central AsiaEurope & Central Asia (excluding high income)Europe & Central Asia (IDA & IBRD countries)European UnionFaroe IslandsFijiFinlandFragile and conflict affected situationsFranceFrench PolynesiaGabonGambia, TheGeorgiaGermanyGhanaGibraltarGreeceGreenlandGrenadaGuamGuatemalaGuineaGuinea-BissauGuyanaHaitiHeavily indebted poor countries (HIPC)High incomeHondurasHong Kong SAR, ChinaHungaryIBRD onlyIcelandIDA & IBRD totalIDA blendIDA onlyIDA totalIndiaIndonesiaIran, Islamic Rep.IraqIrelandIsle of ManIsraelItalyJamaicaJapanJordanKazakhstanKenyaKiribatiKorea, Dem. People’s Rep.Korea, Rep.KosovoKuwaitKyrgyz RepublicLao PDRLate-demographic dividendLatin America & Caribbean Latin America & Caribbean (excluding high income)Latin America & the Caribbean (IDA & IBRD countries)LatviaLeast developed countries: UN classificationLebanonLesothoLiberiaLibyaLiechtensteinLithuaniaLow & middle incomeLow incomeLower middle incomeLuxembourgMacao SAR, ChinaMacedonia, FYRMadagascarMalawiMalaysiaMaldivesMaliMaltaMarshall IslandsMauritaniaMauritiusMexicoMicronesia, Fed. Sts.Middle East & North AfricaMiddle East & North Africa (excluding high income)Middle East & North Africa (IDA & IBRD countries)Middle incomeMoldovaMonacoMongoliaMontenegroMoroccoMozambiqueMyanmarNamibiaNauruNepalNetherlandsNew CaledoniaNew ZealandNicaraguaNigerNigeriaNorth AmericaNorthern Mariana IslandsNorwayOECD membersOmanOther small statesPacific island small statesPakistanPalauPanamaPapua New GuineaParaguayPeruPhilippinesPolandPortugalPost-demographic dividendPre-demographic dividendPuerto RicoQatarRomaniaRussian FederationRwandaSamoaSan MarinoSao Tome and PrincipeSaudi ArabiaSenegalSerbiaSeychellesSierra LeoneSingaporeSint Maarten (Dutch part)Slovak RepublicSloveniaSmall statesSolomon IslandsSomaliaSouth AfricaSouth AsiaSouth Asia (IDA & IBRD)SpainSri LankaSt. Kitts and NevisSt. LuciaSt. Martin (French part)St. Vincent and the GrenadinesSub-Saharan Africa Sub-Saharan Africa (excluding high income)Sub-Saharan Africa (IDA & IBRD countries)SudanSurinameSwazilandSwedenSwitzerlandSyrian Arab RepublicTajikistanTanzaniaThailandTimor-LesteTogoTongaTrinidad and TobagoTunisiaTurkeyTurkmenistanTurks and Caicos IslandsTuvaluUgandaUkraineUnited Arab EmiratesUnited KingdomUnited StatesUpper middle incomeUruguayUzbekistanVanuatuVenezuela, RBVietnamVirgin Islands (U.S.)West Bank and GazaWorldYemen, Rep.ZambiaZimbabwe Timeline:
This timeline shows a graph from 1962 to 2016 of Liechtenstein. No data until 1961. Number of actual observations by date: 55.
Source name:
World Development Indicators
Source organization:
Food and Agriculture Organization and World Bank population estimates.
Categories, topics:
Urban Development
Last updated:
apr 23, 2017
Indicators value changes by year
Minimum:
105.588
jan 1, 1962
Maximum:
234.569
jan 1, 2016
At the date of observation
Value
Absolute change
Change from previous value
jan 1, 1962
105.588
+105.588
0.0%
jan 1, 1963
108.112
+2.525
2.39%
jan 1, 1964
110.763
+2.65
2.45%
jan 1, 1965
113.563
+2.8
2.53%
jan 1, 1966
116.544
+2.981
2.63%
jan 1, 1967
119.725
+3.181
2.73%
jan 1, 1968
123.069
+3.344
2.79%
jan 1, 1969
126.469
+3.4
2.76%
jan 1, 1970
129.781
+3.313
2.62%
jan 1, 1971
132.912
+3.131
2.41%
jan 1, 1972
135.787
+2.875
2.16%
jan 1, 1973
138.456
+2.669
1.97%
jan 1, 1974
141.012
+2.556
1.85%
jan 1, 1975
143.65
+2.638
1.87%
jan 1, 1976
146.469
+2.819
1.96%
jan 1, 1977
149.537
+3.069
2.1%
jan 1, 1978
152.775
+3.238
2.17%
jan 1, 1979
156.019
+3.244
2.12%
jan 1, 1980
159.044
+3.025
1.94%
jan 1, 1981
161.681
+2.638
1.66%
jan 1, 1982
163.881
+2.2
1.36%
jan 1, 1983
165.713
+1.831
1.12%
jan 1, 1984
167.3
+1.588
0.96%
jan 1, 1985
168.806
+1.506
0.9%
jan 1, 1986
170.369
+1.563
0.93%
jan 1, 1987
172.019
+1.65
0.97%
jan 1, 1988
173.744
+1.725
1.0%
jan 1, 1989
175.569
+1.825
1.05%
jan 1, 1990
177.531
+1.963
1.12%
jan 1, 1991
179.656
+2.125
1.2%
jan 1, 1992
181.944
+2.287
1.27%
jan 1, 1993
184.394
+2.45
1.35%
jan 1, 1994
187.006
+2.612
1.42%
jan 1, 1995
189.781
+2.775
1.48%
jan 1, 1996
192.706
+2.925
1.54%
jan 1, 1997
195.794
+3.087
1.6%
jan 1, 1998
199.012
+3.219
1.64%
jan 1, 1999
202.231
+3.219
1.62%
jan 1, 2000
205.269
+3.038
1.5%
jan 1, 2001
208.012
+2.744
1.34%
jan 1, 2002
210.394
+2.381
1.14%
jan 1, 2003
212.469
+2.075
0.99%
jan 1, 2004
214.313
+1.844
0.87%
jan 1, 2005
216.056
+1.744
0.81%
jan 1, 2006
217.825
+1.769
0.82%
jan 1, 2007
219.631
+1.806
0.83%
jan 1, 2008
221.444
+1.813
0.83%
jan 1, 2009
223.256
+1.813
0.82%
jan 1, 2010
225.025
+1.769
0.79%
jan 1, 2011
226.725
+1.7
0.76%
jan 1, 2012
228.356
+1.631
0.72%
jan 1, 2013
229.944
+1.588
0.7%
jan 1, 2014
231.5
+1.556
0.68%
jan 1, 2015
233.037
+1.537
0.66%
jan 1, 2016
234.569
+1.531
0.66%
Ranking of countries by current statistics by years


Comments: