29
/
en
AIzaSyAYiBZKx7MnpbEhh9jyipgxe19OcubqV5w
April 1, 2024
159797
Ireland
IRL
true
2
1
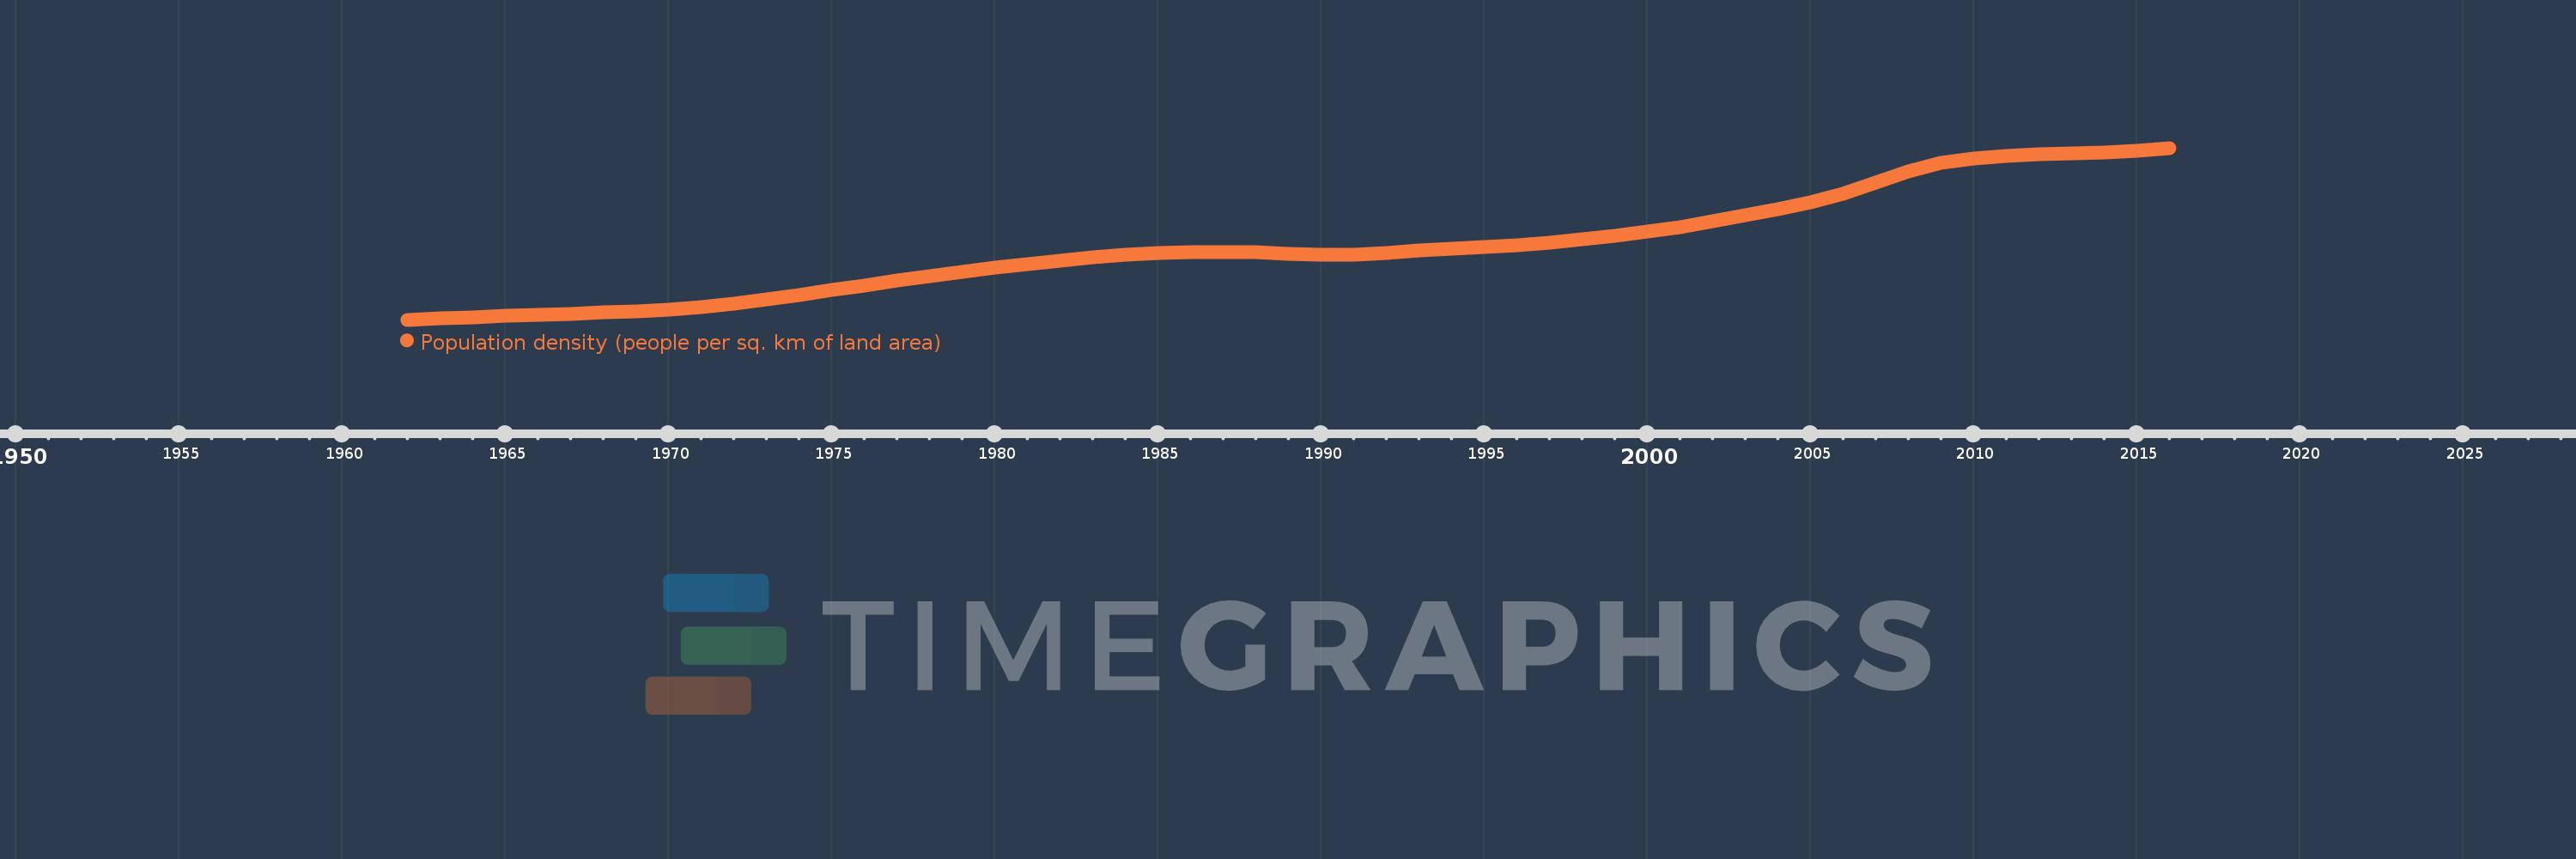
Population density (people per sq. km of land area)
2016,2015,2014,2013,2012,2011,2010,2009,2008,2007,2006,2005,2004,2003,2002,2001,2000,1999,1998,1997,1996,1995,1994,1993,1992,1991,1990,1989,1988,1987,1986,1985,1984,1983,1982,1981,1980,1979,1978,1977,1976,1975,1974,1973,1972,1971,1970,1969,1968,1967,1966,1965,1964,1963,1962
This statistics in other country:
AfghanistanAlbaniaAlgeriaAmerican SamoaAndorraAngolaAntigua and BarbudaArab WorldArgentinaArmeniaArubaAustraliaAustriaAzerbaijanBahamas, TheBahrainBangladeshBarbadosBelarusBelgiumBelizeBeninBermudaBhutanBoliviaBosnia and HerzegovinaBotswanaBrazilBritish Virgin IslandsBrunei DarussalamBulgariaBurkina FasoBurundiCabo VerdeCambodiaCameroonCanadaCaribbean small statesCayman IslandsCentral African RepublicCentral Europe and the BalticsChadChannel IslandsChileChinaColombiaComorosCongo, Dem. Rep.Congo, Rep.Costa RicaCote d'IvoireCroatiaCubaCuracaoCyprusCzech RepublicDenmarkDjiboutiDominicaDominican RepublicEarly-demographic dividendEast Asia & PacificEast Asia & Pacific (excluding high income)East Asia & Pacific (IDA & IBRD countries)EcuadorEgypt, Arab Rep.El SalvadorEquatorial GuineaEritreaEstoniaEthiopiaEuro areaEurope & Central AsiaEurope & Central Asia (excluding high income)Europe & Central Asia (IDA & IBRD countries)European UnionFaroe IslandsFijiFinlandFragile and conflict affected situationsFranceFrench PolynesiaGabonGambia, TheGeorgiaGermanyGhanaGibraltarGreeceGreenlandGrenadaGuamGuatemalaGuineaGuinea-BissauGuyanaHaitiHeavily indebted poor countries (HIPC)High incomeHondurasHong Kong SAR, ChinaHungaryIBRD onlyIcelandIDA & IBRD totalIDA blendIDA onlyIDA totalIndiaIndonesiaIran, Islamic Rep.IraqIrelandIsle of ManIsraelItalyJamaicaJapanJordanKazakhstanKenyaKiribatiKorea, Dem. People’s Rep.Korea, Rep.KosovoKuwaitKyrgyz RepublicLao PDRLate-demographic dividendLatin America & Caribbean Latin America & Caribbean (excluding high income)Latin America & the Caribbean (IDA & IBRD countries)LatviaLeast developed countries: UN classificationLebanonLesothoLiberiaLibyaLiechtensteinLithuaniaLow & middle incomeLow incomeLower middle incomeLuxembourgMacao SAR, ChinaMacedonia, FYRMadagascarMalawiMalaysiaMaldivesMaliMaltaMarshall IslandsMauritaniaMauritiusMexicoMicronesia, Fed. Sts.Middle East & North AfricaMiddle East & North Africa (excluding high income)Middle East & North Africa (IDA & IBRD countries)Middle incomeMoldovaMonacoMongoliaMontenegroMoroccoMozambiqueMyanmarNamibiaNauruNepalNetherlandsNew CaledoniaNew ZealandNicaraguaNigerNigeriaNorth AmericaNorthern Mariana IslandsNorwayOECD membersOmanOther small statesPacific island small statesPakistanPalauPanamaPapua New GuineaParaguayPeruPhilippinesPolandPortugalPost-demographic dividendPre-demographic dividendPuerto RicoQatarRomaniaRussian FederationRwandaSamoaSan MarinoSao Tome and PrincipeSaudi ArabiaSenegalSerbiaSeychellesSierra LeoneSingaporeSint Maarten (Dutch part)Slovak RepublicSloveniaSmall statesSolomon IslandsSomaliaSouth AfricaSouth AsiaSouth Asia (IDA & IBRD)SpainSri LankaSt. Kitts and NevisSt. LuciaSt. Martin (French part)St. Vincent and the GrenadinesSub-Saharan Africa Sub-Saharan Africa (excluding high income)Sub-Saharan Africa (IDA & IBRD countries)SudanSurinameSwazilandSwedenSwitzerlandSyrian Arab RepublicTajikistanTanzaniaThailandTimor-LesteTogoTongaTrinidad and TobagoTunisiaTurkeyTurkmenistanTurks and Caicos IslandsTuvaluUgandaUkraineUnited Arab EmiratesUnited KingdomUnited StatesUpper middle incomeUruguayUzbekistanVanuatuVenezuela, RBVietnamVirgin Islands (U.S.)West Bank and GazaWorldYemen, Rep.ZambiaZimbabwe Timeline:
This timeline shows a graph from 1962 to 2016 of Ireland. No data until 1961. Number of actual observations by date: 55.
Source name:
World Development Indicators
Source organization:
Food and Agriculture Organization and World Bank population estimates.
Categories, topics:
Urban Development
Last updated:
apr 23, 2017
Indicators value changes by year
Minimum:
40.999
jan 1, 1962
Maximum:
67.408
jan 1, 2016
At the date of observation
Value
Absolute change
Change from previous value
jan 1, 1962
40.999
+40.999
0.0%
jan 1, 1963
41.168
+0.169
0.41%
jan 1, 1964
41.409
+0.241
0.59%
jan 1, 1965
41.611
+0.202
0.49%
jan 1, 1966
41.767
+0.156
0.38%
jan 1, 1967
41.934
+0.167
0.4%
jan 1, 1968
42.132
+0.198
0.47%
jan 1, 1969
42.322
+0.19
0.45%
jan 1, 1970
42.57
+0.248
0.59%
jan 1, 1971
42.927
+0.357
0.84%
jan 1, 1972
43.432
+0.505
1.18%
jan 1, 1973
44.083
+0.65
1.5%
jan 1, 1974
44.795
+0.713
1.62%
jan 1, 1975
45.544
+0.748
1.67%
jan 1, 1976
46.299
+0.756
1.66%
jan 1, 1977
47.003
+0.704
1.52%
jan 1, 1978
47.644
+0.641
1.36%
jan 1, 1979
48.325
+0.681
1.43%
jan 1, 1980
48.973
+0.648
1.34%
jan 1, 1981
49.54
+0.567
1.16%
jan 1, 1982
50.123
+0.584
1.18%
jan 1, 1983
50.6
+0.476
0.95%
jan 1, 1984
50.96
+0.36
0.71%
jan 1, 1985
51.276
+0.317
0.62%
jan 1, 1986
51.358
+0.082
0.16%
jan 1, 1987
51.382
+0.023
0.05%
jan 1, 1988
51.387
+0.005
0.01%
jan 1, 1989
51.168
-0.219
-0.43%
jan 1, 1990
50.965
-0.202
-0.4%
jan 1, 1991
51.008
+0.043
0.08%
jan 1, 1992
51.303
+0.294
0.58%
jan 1, 1993
51.654
+0.351
0.68%
jan 1, 1994
51.913
+0.259
0.5%
jan 1, 1995
52.118
+0.205
0.39%
jan 1, 1996
52.386
+0.268
0.51%
jan 1, 1997
52.802
+0.416
0.79%
jan 1, 1998
53.334
+0.532
1.01%
jan 1, 1999
53.893
+0.559
1.05%
jan 1, 2000
54.504
+0.611
1.13%
jan 1, 2001
55.236
+0.731
1.34%
jan 1, 2002
56.122
+0.886
1.6%
jan 1, 2003
57.076
+0.954
1.7%
jan 1, 2004
58.013
+0.937
1.64%
jan 1, 2005
59.083
+1.07
1.85%
jan 1, 2006
60.385
+1.301
2.2%
jan 1, 2007
62.035
+1.65
2.73%
jan 1, 2008
63.855
+1.82
2.93%
jan 1, 2009
65.17
+1.315
2.06%
jan 1, 2010
65.835
+0.665
1.02%
jan 1, 2011
66.195
+0.36
0.55%
jan 1, 2012
66.436
+0.242
0.36%
jan 1, 2013
66.583
+0.147
0.22%
jan 1, 2014
66.748
+0.165
0.25%
jan 1, 2015
67.023
+0.275
0.41%
jan 1, 2016
67.408
+0.385
0.57%
Ranking of countries by current statistics by years


Comments: