29
/
en
AIzaSyAYiBZKx7MnpbEhh9jyipgxe19OcubqV5w
April 1, 2024
150890
Honduras
HND
true
2
1
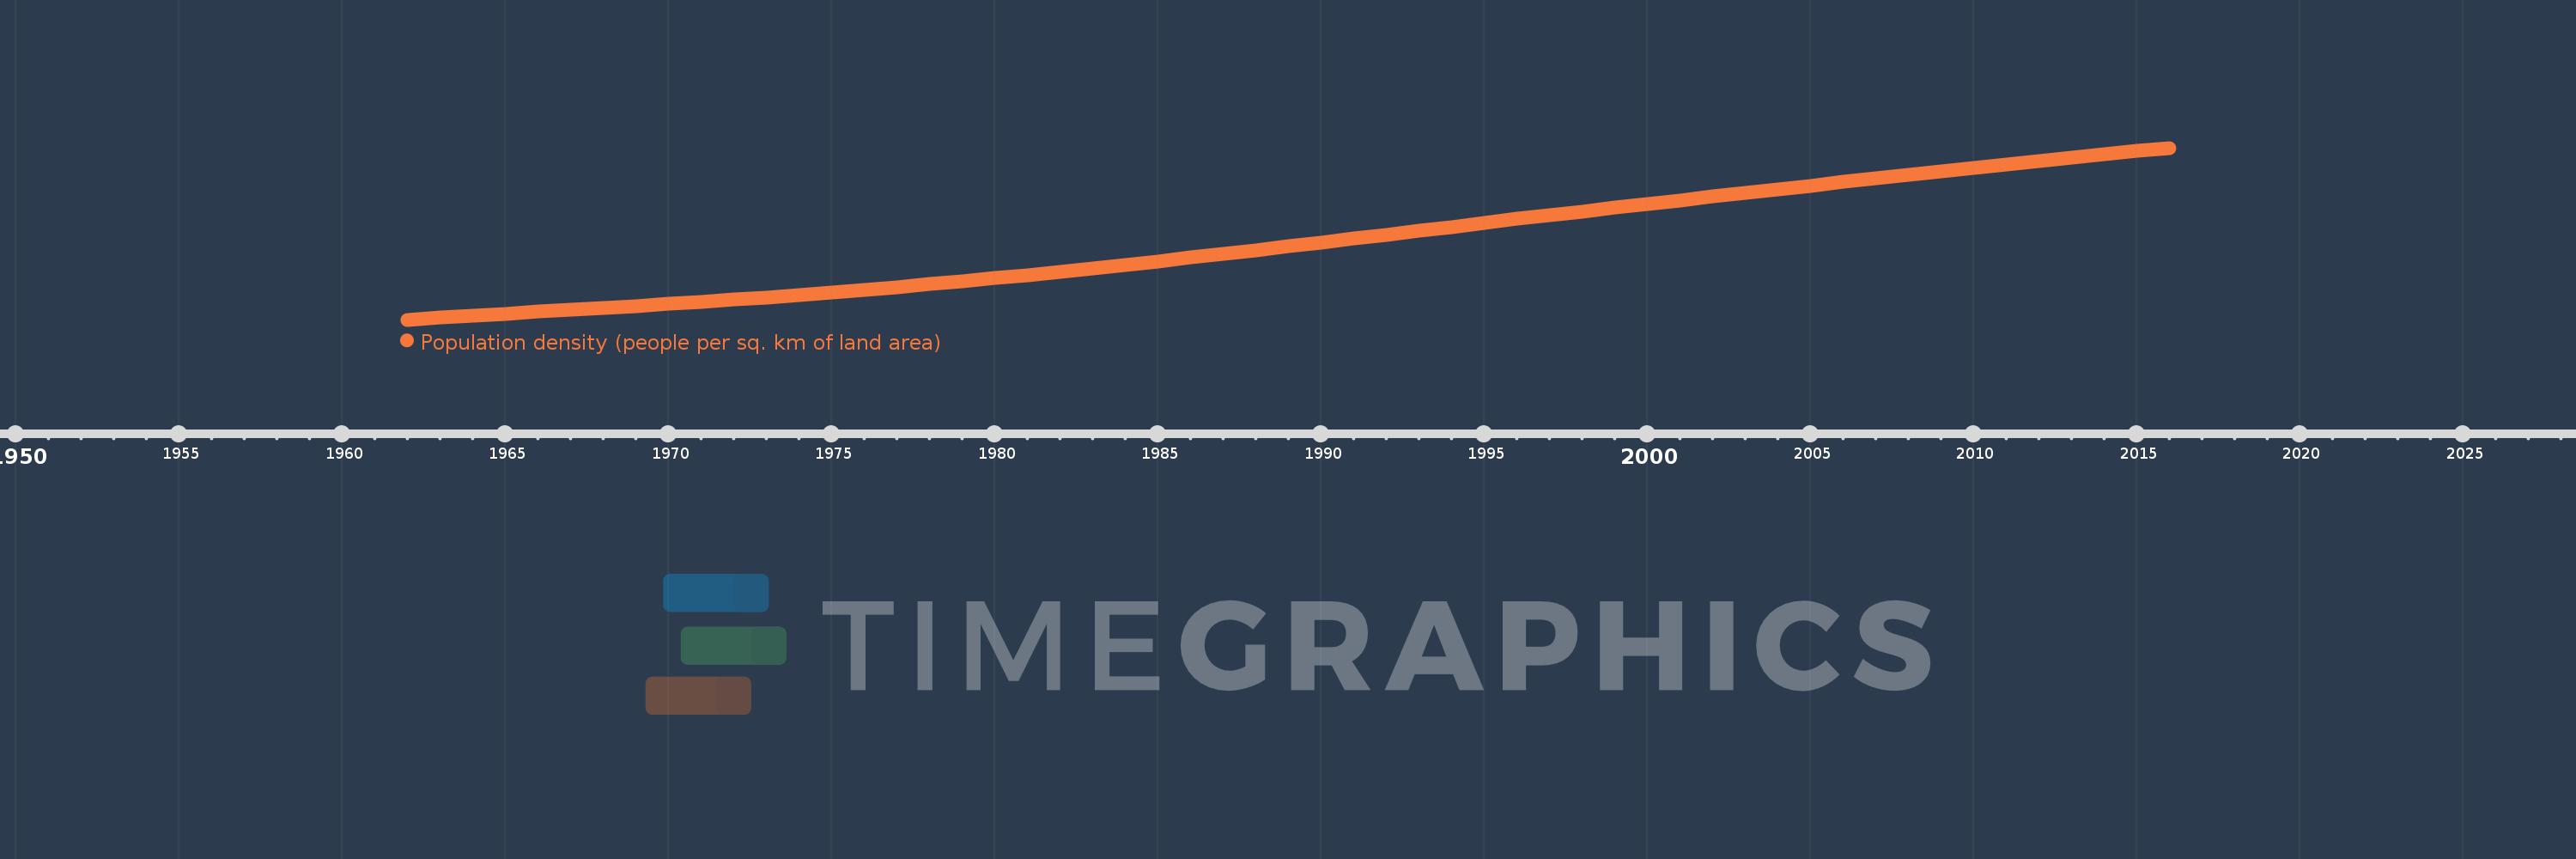
Population density (people per sq. km of land area)
2016,2015,2014,2013,2012,2011,2010,2009,2008,2007,2006,2005,2004,2003,2002,2001,2000,1999,1998,1997,1996,1995,1994,1993,1992,1991,1990,1989,1988,1987,1986,1985,1984,1983,1982,1981,1980,1979,1978,1977,1976,1975,1974,1973,1972,1971,1970,1969,1968,1967,1966,1965,1964,1963,1962
This statistics in other country:
AfghanistanAlbaniaAlgeriaAmerican SamoaAndorraAngolaAntigua and BarbudaArab WorldArgentinaArmeniaArubaAustraliaAustriaAzerbaijanBahamas, TheBahrainBangladeshBarbadosBelarusBelgiumBelizeBeninBermudaBhutanBoliviaBosnia and HerzegovinaBotswanaBrazilBritish Virgin IslandsBrunei DarussalamBulgariaBurkina FasoBurundiCabo VerdeCambodiaCameroonCanadaCaribbean small statesCayman IslandsCentral African RepublicCentral Europe and the BalticsChadChannel IslandsChileChinaColombiaComorosCongo, Dem. Rep.Congo, Rep.Costa RicaCote d'IvoireCroatiaCubaCuracaoCyprusCzech RepublicDenmarkDjiboutiDominicaDominican RepublicEarly-demographic dividendEast Asia & PacificEast Asia & Pacific (excluding high income)East Asia & Pacific (IDA & IBRD countries)EcuadorEgypt, Arab Rep.El SalvadorEquatorial GuineaEritreaEstoniaEthiopiaEuro areaEurope & Central AsiaEurope & Central Asia (excluding high income)Europe & Central Asia (IDA & IBRD countries)European UnionFaroe IslandsFijiFinlandFragile and conflict affected situationsFranceFrench PolynesiaGabonGambia, TheGeorgiaGermanyGhanaGibraltarGreeceGreenlandGrenadaGuamGuatemalaGuineaGuinea-BissauGuyanaHaitiHeavily indebted poor countries (HIPC)High incomeHondurasHong Kong SAR, ChinaHungaryIBRD onlyIcelandIDA & IBRD totalIDA blendIDA onlyIDA totalIndiaIndonesiaIran, Islamic Rep.IraqIrelandIsle of ManIsraelItalyJamaicaJapanJordanKazakhstanKenyaKiribatiKorea, Dem. People’s Rep.Korea, Rep.KosovoKuwaitKyrgyz RepublicLao PDRLate-demographic dividendLatin America & Caribbean Latin America & Caribbean (excluding high income)Latin America & the Caribbean (IDA & IBRD countries)LatviaLeast developed countries: UN classificationLebanonLesothoLiberiaLibyaLiechtensteinLithuaniaLow & middle incomeLow incomeLower middle incomeLuxembourgMacao SAR, ChinaMacedonia, FYRMadagascarMalawiMalaysiaMaldivesMaliMaltaMarshall IslandsMauritaniaMauritiusMexicoMicronesia, Fed. Sts.Middle East & North AfricaMiddle East & North Africa (excluding high income)Middle East & North Africa (IDA & IBRD countries)Middle incomeMoldovaMonacoMongoliaMontenegroMoroccoMozambiqueMyanmarNamibiaNauruNepalNetherlandsNew CaledoniaNew ZealandNicaraguaNigerNigeriaNorth AmericaNorthern Mariana IslandsNorwayOECD membersOmanOther small statesPacific island small statesPakistanPalauPanamaPapua New GuineaParaguayPeruPhilippinesPolandPortugalPost-demographic dividendPre-demographic dividendPuerto RicoQatarRomaniaRussian FederationRwandaSamoaSan MarinoSao Tome and PrincipeSaudi ArabiaSenegalSerbiaSeychellesSierra LeoneSingaporeSint Maarten (Dutch part)Slovak RepublicSloveniaSmall statesSolomon IslandsSomaliaSouth AfricaSouth AsiaSouth Asia (IDA & IBRD)SpainSri LankaSt. Kitts and NevisSt. LuciaSt. Martin (French part)St. Vincent and the GrenadinesSub-Saharan Africa Sub-Saharan Africa (excluding high income)Sub-Saharan Africa (IDA & IBRD countries)SudanSurinameSwazilandSwedenSwitzerlandSyrian Arab RepublicTajikistanTanzaniaThailandTimor-LesteTogoTongaTrinidad and TobagoTunisiaTurkeyTurkmenistanTurks and Caicos IslandsTuvaluUgandaUkraineUnited Arab EmiratesUnited KingdomUnited StatesUpper middle incomeUruguayUzbekistanVanuatuVenezuela, RBVietnamVirgin Islands (U.S.)West Bank and GazaWorldYemen, Rep.ZambiaZimbabwe Timeline:
This timeline shows a graph from 1962 to 2016 of Honduras. No data until 1961. Number of actual observations by date: 55.
Source name:
World Development Indicators
Source organization:
Food and Agriculture Organization and World Bank population estimates.
Categories, topics:
Urban Development
Last updated:
apr 23, 2017
Indicators value changes by year
Minimum:
18.492
jan 1, 1962
At the date of observation
Value
Absolute change
Change from previous value
jan 1, 1962
18.492
+18.492
0.0%
jan 1, 1963
19.119
+0.627
3.39%
jan 1, 1964
19.762
+0.643
3.36%
jan 1, 1965
20.402
+0.64
3.24%
jan 1, 1966
21.026
+0.624
3.06%
jan 1, 1967
21.63
+0.604
2.87%
jan 1, 1968
22.221
+0.59
2.73%
jan 1, 1969
22.81
+0.589
2.65%
jan 1, 1970
23.416
+0.606
2.66%
jan 1, 1971
24.053
+0.637
2.72%
jan 1, 1972
24.725
+0.672
2.79%
jan 1, 1973
25.429
+0.704
2.85%
jan 1, 1974
26.17
+0.741
2.91%
jan 1, 1975
26.952
+0.781
2.99%
jan 1, 1976
27.775
+0.823
3.06%
jan 1, 1977
28.643
+0.868
3.13%
jan 1, 1978
29.556
+0.913
3.19%
jan 1, 1979
30.507
+0.951
3.22%
jan 1, 1980
31.489
+0.982
3.22%
jan 1, 1981
32.495
+1.006
3.2%
jan 1, 1982
33.523
+1.028
3.16%
jan 1, 1983
34.572
+1.05
3.13%
jan 1, 1984
35.645
+1.073
3.1%
jan 1, 1985
36.745
+1.099
3.08%
jan 1, 1986
37.871
+1.127
3.07%
jan 1, 1987
39.024
+1.153
3.04%
jan 1, 1988
40.199
+1.175
3.01%
jan 1, 1989
41.393
+1.194
2.97%
jan 1, 1990
42.603
+1.209
2.92%
jan 1, 1991
43.823
+1.22
2.86%
jan 1, 1992
45.054
+1.231
2.81%
jan 1, 1993
46.292
+1.238
2.75%
jan 1, 1994
47.529
+1.238
2.67%
jan 1, 1995
48.758
+1.228
2.58%
jan 1, 1996
49.97
+1.212
2.49%
jan 1, 1997
51.163
+1.193
2.39%
jan 1, 1998
52.337
+1.174
2.29%
jan 1, 1999
53.496
+1.159
2.22%
jan 1, 2000
54.648
+1.152
2.15%
jan 1, 2001
55.797
+1.149
2.1%
jan 1, 2002
56.943
+1.146
2.05%
jan 1, 2003
58.084
+1.141
2.0%
jan 1, 2004
59.222
+1.138
1.96%
jan 1, 2005
60.357
+1.135
1.92%
jan 1, 2006
61.491
+1.134
1.88%
jan 1, 2007
62.624
+1.134
1.84%
jan 1, 2008
63.757
+1.132
1.81%
jan 1, 2009
64.88
+1.124
1.76%
jan 1, 2010
65.985
+1.105
1.7%
jan 1, 2011
67.065
+1.079
1.64%
jan 1, 2012
68.115
+1.05
1.57%
jan 1, 2013
69.141
+1.025
1.51%
jan 1, 2014
70.15
+1.009
1.46%
jan 1, 2015
71.156
+1.007
1.43%
jan 1, 2016
72.17
+1.013
1.42%
Ranking of countries by current statistics by years


Comments: