29
/
en
AIzaSyAYiBZKx7MnpbEhh9jyipgxe19OcubqV5w
April 1, 2024
172101
Kuwait
KWT
true
2
1
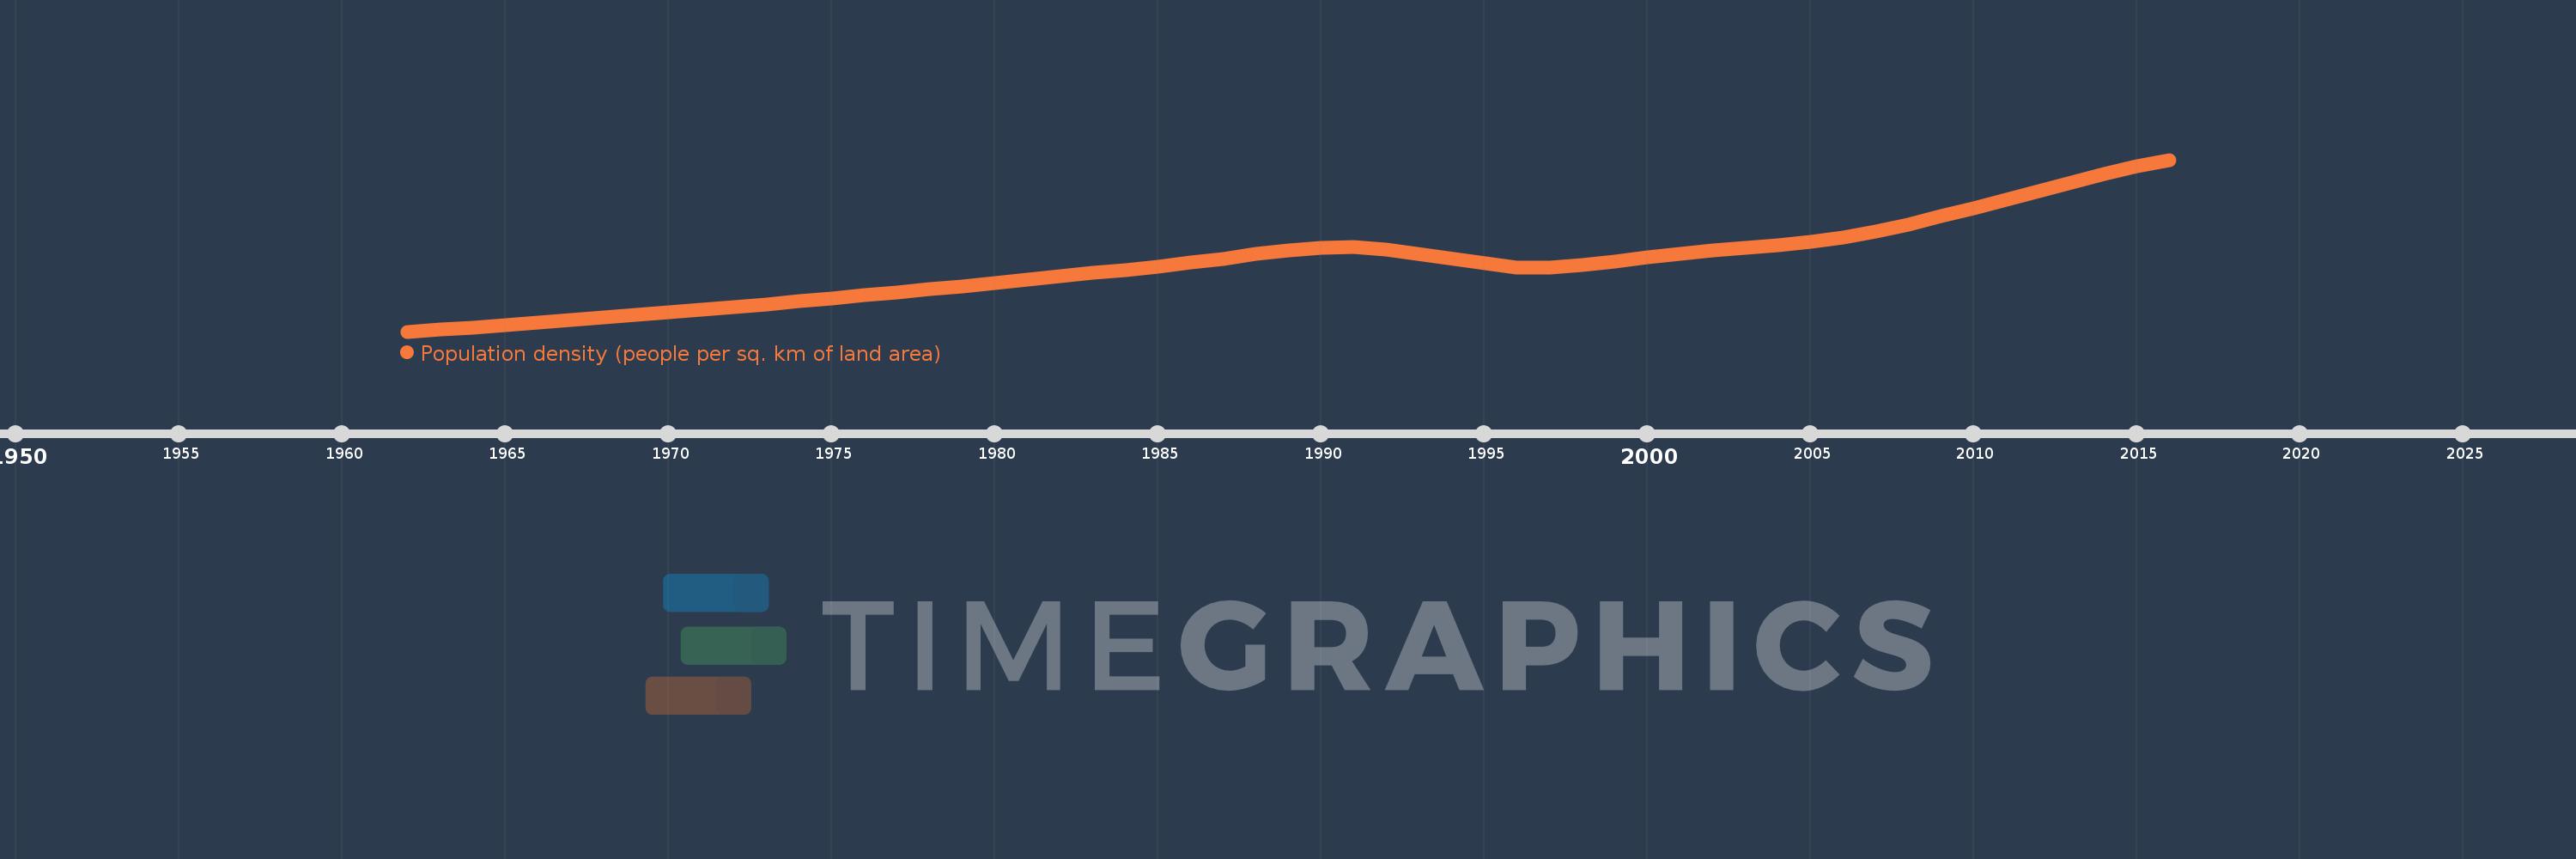
Population density (people per sq. km of land area)
2016,2015,2014,2013,2012,2011,2010,2009,2008,2007,2006,2005,2004,2003,2002,2001,2000,1999,1998,1997,1996,1992,1991,1990,1989,1988,1987,1986,1985,1984,1983,1982,1981,1980,1979,1978,1977,1976,1975,1974,1973,1972,1971,1970,1969,1968,1967,1966,1965,1964,1963,1962
This statistics in other country:
AfghanistanAlbaniaAlgeriaAmerican SamoaAndorraAngolaAntigua and BarbudaArab WorldArgentinaArmeniaArubaAustraliaAustriaAzerbaijanBahamas, TheBahrainBangladeshBarbadosBelarusBelgiumBelizeBeninBermudaBhutanBoliviaBosnia and HerzegovinaBotswanaBrazilBritish Virgin IslandsBrunei DarussalamBulgariaBurkina FasoBurundiCabo VerdeCambodiaCameroonCanadaCaribbean small statesCayman IslandsCentral African RepublicCentral Europe and the BalticsChadChannel IslandsChileChinaColombiaComorosCongo, Dem. Rep.Congo, Rep.Costa RicaCote d'IvoireCroatiaCubaCuracaoCyprusCzech RepublicDenmarkDjiboutiDominicaDominican RepublicEarly-demographic dividendEast Asia & PacificEast Asia & Pacific (excluding high income)East Asia & Pacific (IDA & IBRD countries)EcuadorEgypt, Arab Rep.El SalvadorEquatorial GuineaEritreaEstoniaEthiopiaEuro areaEurope & Central AsiaEurope & Central Asia (excluding high income)Europe & Central Asia (IDA & IBRD countries)European UnionFaroe IslandsFijiFinlandFragile and conflict affected situationsFranceFrench PolynesiaGabonGambia, TheGeorgiaGermanyGhanaGibraltarGreeceGreenlandGrenadaGuamGuatemalaGuineaGuinea-BissauGuyanaHaitiHeavily indebted poor countries (HIPC)High incomeHondurasHong Kong SAR, ChinaHungaryIBRD onlyIcelandIDA & IBRD totalIDA blendIDA onlyIDA totalIndiaIndonesiaIran, Islamic Rep.IraqIrelandIsle of ManIsraelItalyJamaicaJapanJordanKazakhstanKenyaKiribatiKorea, Dem. People’s Rep.Korea, Rep.KosovoKuwaitKyrgyz RepublicLao PDRLate-demographic dividendLatin America & Caribbean Latin America & Caribbean (excluding high income)Latin America & the Caribbean (IDA & IBRD countries)LatviaLeast developed countries: UN classificationLebanonLesothoLiberiaLibyaLiechtensteinLithuaniaLow & middle incomeLow incomeLower middle incomeLuxembourgMacao SAR, ChinaMacedonia, FYRMadagascarMalawiMalaysiaMaldivesMaliMaltaMarshall IslandsMauritaniaMauritiusMexicoMicronesia, Fed. Sts.Middle East & North AfricaMiddle East & North Africa (excluding high income)Middle East & North Africa (IDA & IBRD countries)Middle incomeMoldovaMonacoMongoliaMontenegroMoroccoMozambiqueMyanmarNamibiaNauruNepalNetherlandsNew CaledoniaNew ZealandNicaraguaNigerNigeriaNorth AmericaNorthern Mariana IslandsNorwayOECD membersOmanOther small statesPacific island small statesPakistanPalauPanamaPapua New GuineaParaguayPeruPhilippinesPolandPortugalPost-demographic dividendPre-demographic dividendPuerto RicoQatarRomaniaRussian FederationRwandaSamoaSan MarinoSao Tome and PrincipeSaudi ArabiaSenegalSerbiaSeychellesSierra LeoneSingaporeSint Maarten (Dutch part)Slovak RepublicSloveniaSmall statesSolomon IslandsSomaliaSouth AfricaSouth AsiaSouth Asia (IDA & IBRD)SpainSri LankaSt. Kitts and NevisSt. LuciaSt. Martin (French part)St. Vincent and the GrenadinesSub-Saharan Africa Sub-Saharan Africa (excluding high income)Sub-Saharan Africa (IDA & IBRD countries)SudanSurinameSwazilandSwedenSwitzerlandSyrian Arab RepublicTajikistanTanzaniaThailandTimor-LesteTogoTongaTrinidad and TobagoTunisiaTurkeyTurkmenistanTurks and Caicos IslandsTuvaluUgandaUkraineUnited Arab EmiratesUnited KingdomUnited StatesUpper middle incomeUruguayUzbekistanVanuatuVenezuela, RBVietnamVirgin Islands (U.S.)West Bank and GazaWorldYemen, Rep.ZambiaZimbabwe Timeline:
This timeline shows a graph from 1962 to 2016 of Kuwait. No data until 1961. Number of actual observations by date: 52.
Source name:
World Development Indicators
Source organization:
Food and Agriculture Organization and World Bank population estimates.
Categories, topics:
Urban Development
Last updated:
apr 23, 2017
Indicators value changes by year
Minimum:
16.534
jan 1, 1962
Maximum:
218.413
jan 1, 2016
At the date of observation
Value
Absolute change
Change from previous value
jan 1, 1962
16.534
+16.534
0.0%
jan 1, 1963
18.808
+2.274
13.75%
jan 1, 1964
21.418
+2.61
13.88%
jan 1, 1965
24.207
+2.789
13.02%
jan 1, 1966
27.058
+2.851
11.78%
jan 1, 1967
29.939
+2.881
10.65%
jan 1, 1968
32.875
+2.935
9.8%
jan 1, 1969
35.868
+2.993
9.1%
jan 1, 1970
38.938
+3.07
8.56%
jan 1, 1971
42.098
+3.16
8.11%
jan 1, 1972
45.337
+3.239
7.69%
jan 1, 1973
48.639
+3.302
7.28%
jan 1, 1974
52.01
+3.371
6.93%
jan 1, 1975
55.458
+3.448
6.63%
jan 1, 1976
58.989
+3.531
6.37%
jan 1, 1977
62.596
+3.607
6.11%
jan 1, 1978
66.27
+3.674
5.87%
jan 1, 1979
70.011
+3.741
5.64%
jan 1, 1980
73.818
+3.806
5.44%
jan 1, 1981
77.685
+3.867
5.24%
jan 1, 1982
81.503
+3.818
4.92%
jan 1, 1983
85.233
+3.73
4.58%
jan 1, 1984
89.013
+3.779
4.43%
jan 1, 1985
93.037
+4.024
4.52%
jan 1, 1986
97.38
+4.343
4.67%
jan 1, 1987
102.312
+4.932
5.06%
jan 1, 1988
107.629
+5.317
5.2%
jan 1, 1989
112.382
+4.753
4.42%
jan 1, 1990
115.289
+2.907
2.59%
jan 1, 1991
115.535
+0.246
0.21%
jan 1, 1992
112.632
-2.902
-2.51%
jan 1, 1996
91.865
-20.768
-18.44%
jan 1, 1997
91.914
+0.049
0.05%
jan 1, 1998
94.627
+2.713
2.95%
jan 1, 1999
99.116
+4.489
4.74%
jan 1, 2000
103.993
+4.877
4.92%
jan 1, 2001
108.276
+4.283
4.12%
jan 1, 2002
111.674
+3.398
3.14%
jan 1, 2003
114.602
+2.929
2.62%
jan 1, 2004
117.62
+3.018
2.63%
jan 1, 2005
121.568
+3.948
3.36%
jan 1, 2006
127.026
+5.458
4.49%
jan 1, 2007
134.091
+7.065
5.56%
jan 1, 2008
142.457
+8.367
6.24%
jan 1, 2009
151.812
+9.355
6.57%
jan 1, 2010
161.686
+9.874
6.5%
jan 1, 2011
171.688
+10.002
6.19%
jan 1, 2012
181.772
+10.085
5.87%
jan 1, 2013
191.896
+10.123
5.57%
jan 1, 2014
201.666
+9.77
5.09%
jan 1, 2015
210.613
+8.947
4.44%
jan 1, 2016
218.413
+7.8
3.7%
Ranking of countries by current statistics by years


Comments: