29
/
en
AIzaSyAYiBZKx7MnpbEhh9jyipgxe19OcubqV5w
April 1, 2024
161862
Italy
ITA
true
2
1
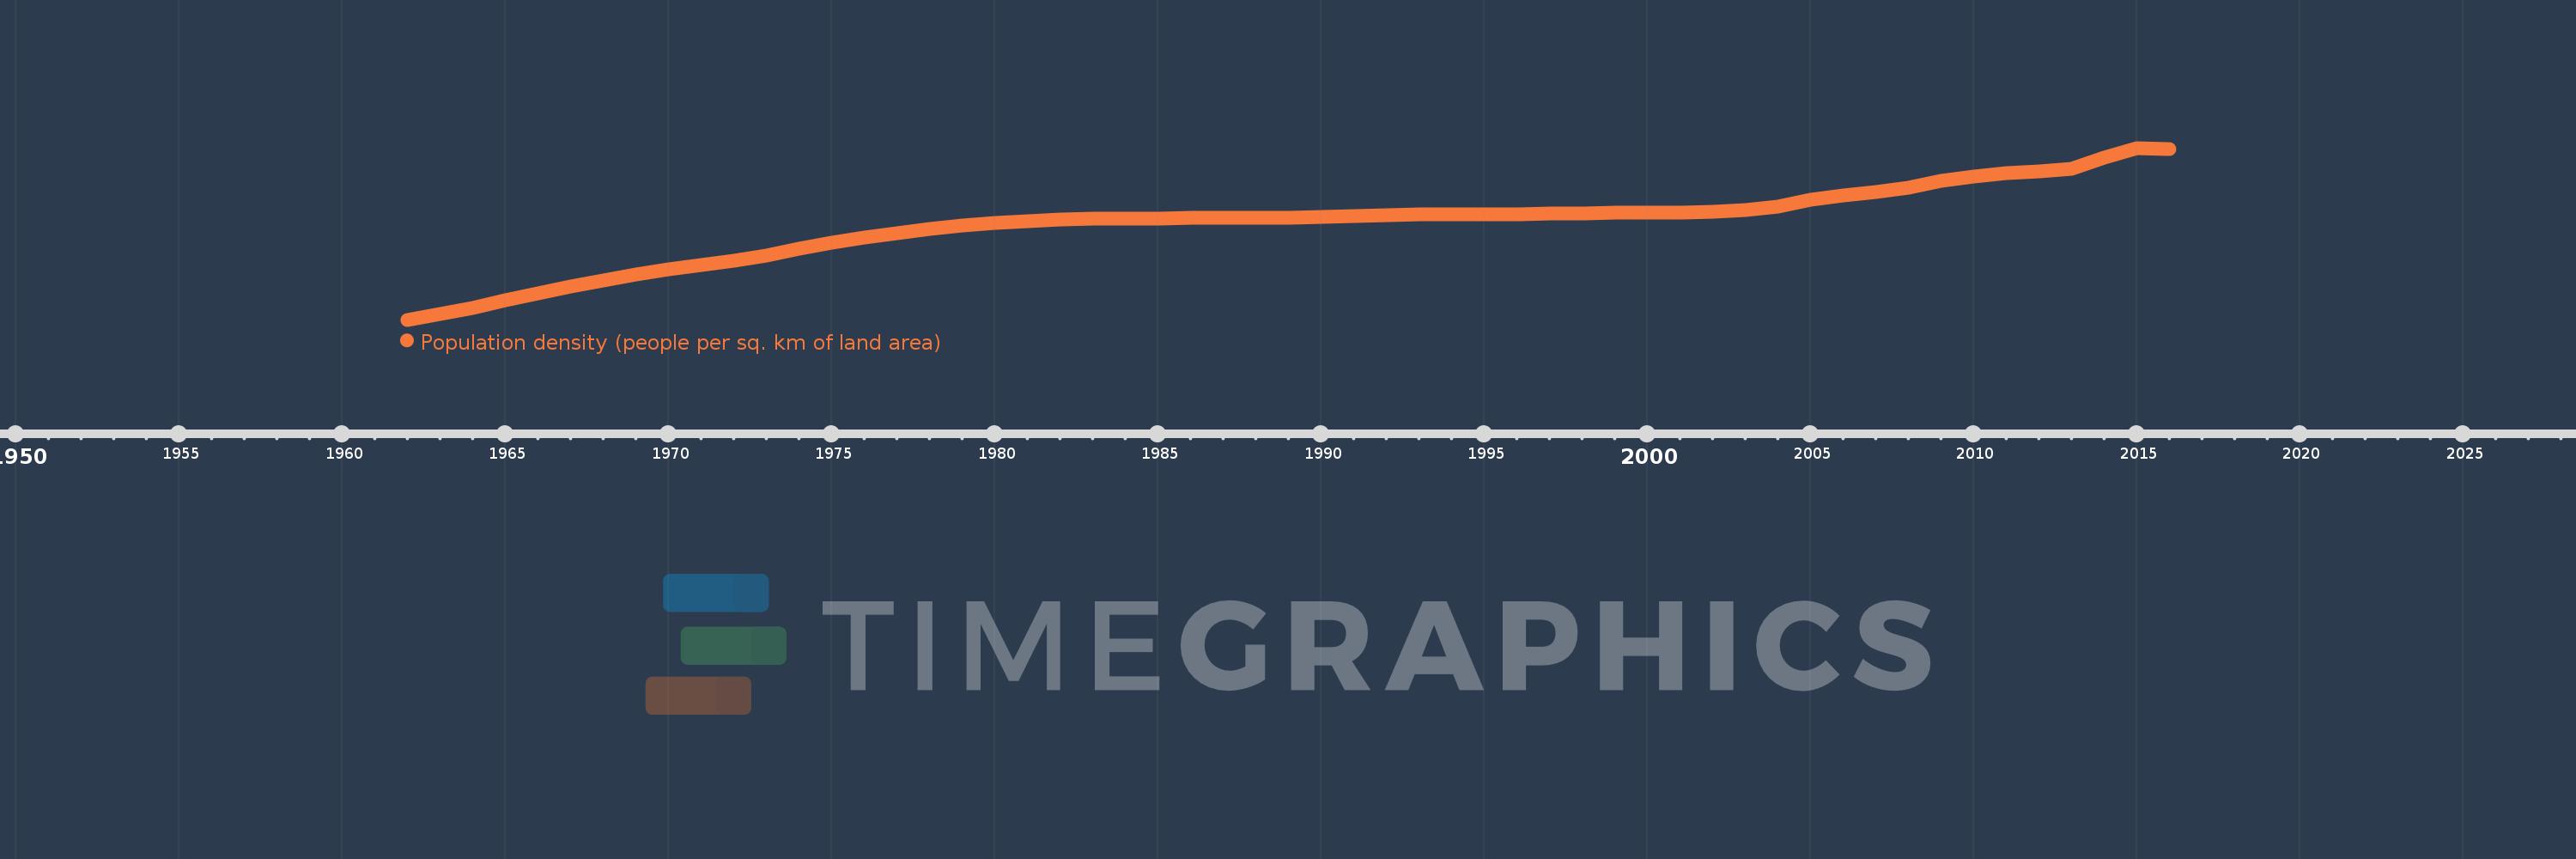
Population density (people per sq. km of land area)
2016,2015,2014,2013,2012,2011,2010,2009,2008,2007,2006,2005,2004,2003,2002,2001,2000,1999,1998,1997,1996,1995,1994,1993,1992,1991,1990,1989,1988,1987,1986,1985,1984,1983,1982,1981,1980,1979,1978,1977,1976,1975,1974,1973,1972,1971,1970,1969,1968,1967,1966,1965,1964,1963,1962
This statistics in other country:
AfghanistanAlbaniaAlgeriaAmerican SamoaAndorraAngolaAntigua and BarbudaArab WorldArgentinaArmeniaArubaAustraliaAustriaAzerbaijanBahamas, TheBahrainBangladeshBarbadosBelarusBelgiumBelizeBeninBermudaBhutanBoliviaBosnia and HerzegovinaBotswanaBrazilBritish Virgin IslandsBrunei DarussalamBulgariaBurkina FasoBurundiCabo VerdeCambodiaCameroonCanadaCaribbean small statesCayman IslandsCentral African RepublicCentral Europe and the BalticsChadChannel IslandsChileChinaColombiaComorosCongo, Dem. Rep.Congo, Rep.Costa RicaCote d'IvoireCroatiaCubaCuracaoCyprusCzech RepublicDenmarkDjiboutiDominicaDominican RepublicEarly-demographic dividendEast Asia & PacificEast Asia & Pacific (excluding high income)East Asia & Pacific (IDA & IBRD countries)EcuadorEgypt, Arab Rep.El SalvadorEquatorial GuineaEritreaEstoniaEthiopiaEuro areaEurope & Central AsiaEurope & Central Asia (excluding high income)Europe & Central Asia (IDA & IBRD countries)European UnionFaroe IslandsFijiFinlandFragile and conflict affected situationsFranceFrench PolynesiaGabonGambia, TheGeorgiaGermanyGhanaGibraltarGreeceGreenlandGrenadaGuamGuatemalaGuineaGuinea-BissauGuyanaHaitiHeavily indebted poor countries (HIPC)High incomeHondurasHong Kong SAR, ChinaHungaryIBRD onlyIcelandIDA & IBRD totalIDA blendIDA onlyIDA totalIndiaIndonesiaIran, Islamic Rep.IraqIrelandIsle of ManIsraelItalyJamaicaJapanJordanKazakhstanKenyaKiribatiKorea, Dem. People’s Rep.Korea, Rep.KosovoKuwaitKyrgyz RepublicLao PDRLate-demographic dividendLatin America & Caribbean Latin America & Caribbean (excluding high income)Latin America & the Caribbean (IDA & IBRD countries)LatviaLeast developed countries: UN classificationLebanonLesothoLiberiaLibyaLiechtensteinLithuaniaLow & middle incomeLow incomeLower middle incomeLuxembourgMacao SAR, ChinaMacedonia, FYRMadagascarMalawiMalaysiaMaldivesMaliMaltaMarshall IslandsMauritaniaMauritiusMexicoMicronesia, Fed. Sts.Middle East & North AfricaMiddle East & North Africa (excluding high income)Middle East & North Africa (IDA & IBRD countries)Middle incomeMoldovaMonacoMongoliaMontenegroMoroccoMozambiqueMyanmarNamibiaNauruNepalNetherlandsNew CaledoniaNew ZealandNicaraguaNigerNigeriaNorth AmericaNorthern Mariana IslandsNorwayOECD membersOmanOther small statesPacific island small statesPakistanPalauPanamaPapua New GuineaParaguayPeruPhilippinesPolandPortugalPost-demographic dividendPre-demographic dividendPuerto RicoQatarRomaniaRussian FederationRwandaSamoaSan MarinoSao Tome and PrincipeSaudi ArabiaSenegalSerbiaSeychellesSierra LeoneSingaporeSint Maarten (Dutch part)Slovak RepublicSloveniaSmall statesSolomon IslandsSomaliaSouth AfricaSouth AsiaSouth Asia (IDA & IBRD)SpainSri LankaSt. Kitts and NevisSt. LuciaSt. Martin (French part)St. Vincent and the GrenadinesSub-Saharan Africa Sub-Saharan Africa (excluding high income)Sub-Saharan Africa (IDA & IBRD countries)SudanSurinameSwazilandSwedenSwitzerlandSyrian Arab RepublicTajikistanTanzaniaThailandTimor-LesteTogoTongaTrinidad and TobagoTunisiaTurkeyTurkmenistanTurks and Caicos IslandsTuvaluUgandaUkraineUnited Arab EmiratesUnited KingdomUnited StatesUpper middle incomeUruguayUzbekistanVanuatuVenezuela, RBVietnamVirgin Islands (U.S.)West Bank and GazaWorldYemen, Rep.ZambiaZimbabwe Timeline:
This timeline shows a graph from 1962 to 2016 of Italy. No data until 1961. Number of actual observations by date: 55.
Source name:
World Development Indicators
Source organization:
Food and Agriculture Organization and World Bank population estimates.
Categories, topics:
Urban Development
Last updated:
apr 23, 2017
Indicators value changes by year
Minimum:
171.828
jan 1, 1962
Maximum:
206.667
jan 1, 2015
At the date of observation
Value
Absolute change
Change from previous value
jan 1, 1962
171.828
+171.828
0.0%
jan 1, 1963
172.995
+1.167
0.68%
jan 1, 1964
174.261
+1.267
0.73%
jan 1, 1965
175.701
+1.439
0.83%
jan 1, 1966
177.187
+1.486
0.85%
jan 1, 1967
178.569
+1.383
0.78%
jan 1, 1968
179.866
+1.297
0.73%
jan 1, 1969
181.006
+1.14
0.63%
jan 1, 1970
182.034
+1.028
0.57%
jan 1, 1971
182.999
+0.965
0.53%
jan 1, 1972
183.855
+0.856
0.47%
jan 1, 1973
184.901
+1.047
0.57%
jan 1, 1974
186.16
+1.258
0.68%
jan 1, 1975
187.382
+1.222
0.66%
jan 1, 1976
188.504
+1.122
0.6%
jan 1, 1977
189.447
+0.943
0.5%
jan 1, 1978
190.253
+0.806
0.43%
jan 1, 1979
190.932
+0.679
0.36%
jan 1, 1980
191.485
+0.553
0.29%
jan 1, 1981
191.88
+0.395
0.21%
jan 1, 1982
192.111
+0.23
0.12%
jan 1, 1983
192.253
+0.142
0.07%
jan 1, 1984
192.323
+0.07
0.04%
jan 1, 1985
192.366
+0.043
0.02%
jan 1, 1986
192.421
+0.056
0.03%
jan 1, 1987
192.432
+0.01
0.01%
jan 1, 1988
192.452
+0.02
0.01%
jan 1, 1989
192.545
+0.093
0.05%
jan 1, 1990
192.689
+0.144
0.08%
jan 1, 1991
192.85
+0.161
0.08%
jan 1, 1992
192.984
+0.134
0.07%
jan 1, 1993
193.115
+0.131
0.07%
jan 1, 1994
193.233
+0.118
0.06%
jan 1, 1995
193.273
+0.039
0.02%
jan 1, 1996
193.276
+0.003
0.0%
jan 1, 1997
193.33
+0.054
0.03%
jan 1, 1998
193.432
+0.102
0.05%
jan 1, 1999
193.488
+0.056
0.03%
jan 1, 2000
193.521
+0.033
0.02%
jan 1, 2001
193.608
+0.088
0.05%
jan 1, 2002
193.717
+0.109
0.06%
jan 1, 2003
194.006
+0.289
0.15%
jan 1, 2004
194.85
+0.844
0.44%
jan 1, 2005
196.115
+1.265
0.65%
jan 1, 2006
197.081
+0.966
0.49%
jan 1, 2007
197.675
+0.593
0.3%
jan 1, 2008
198.675
+1.001
0.51%
jan 1, 2009
199.996
+1.321
0.66%
jan 1, 2010
200.909
+0.913
0.46%
jan 1, 2011
201.528
+0.619
0.31%
jan 1, 2012
201.875
+0.347
0.17%
jan 1, 2013
202.42
+0.545
0.27%
jan 1, 2014
204.78
+2.36
1.17%
jan 1, 2015
206.667
+1.888
0.92%
jan 1, 2016
206.468
-0.199
-0.1%
Ranking of countries by current statistics by years


Comments: