29
/
en
AIzaSyAYiBZKx7MnpbEhh9jyipgxe19OcubqV5w
April 1, 2024
30210
Euro area
EMU
false
2
1
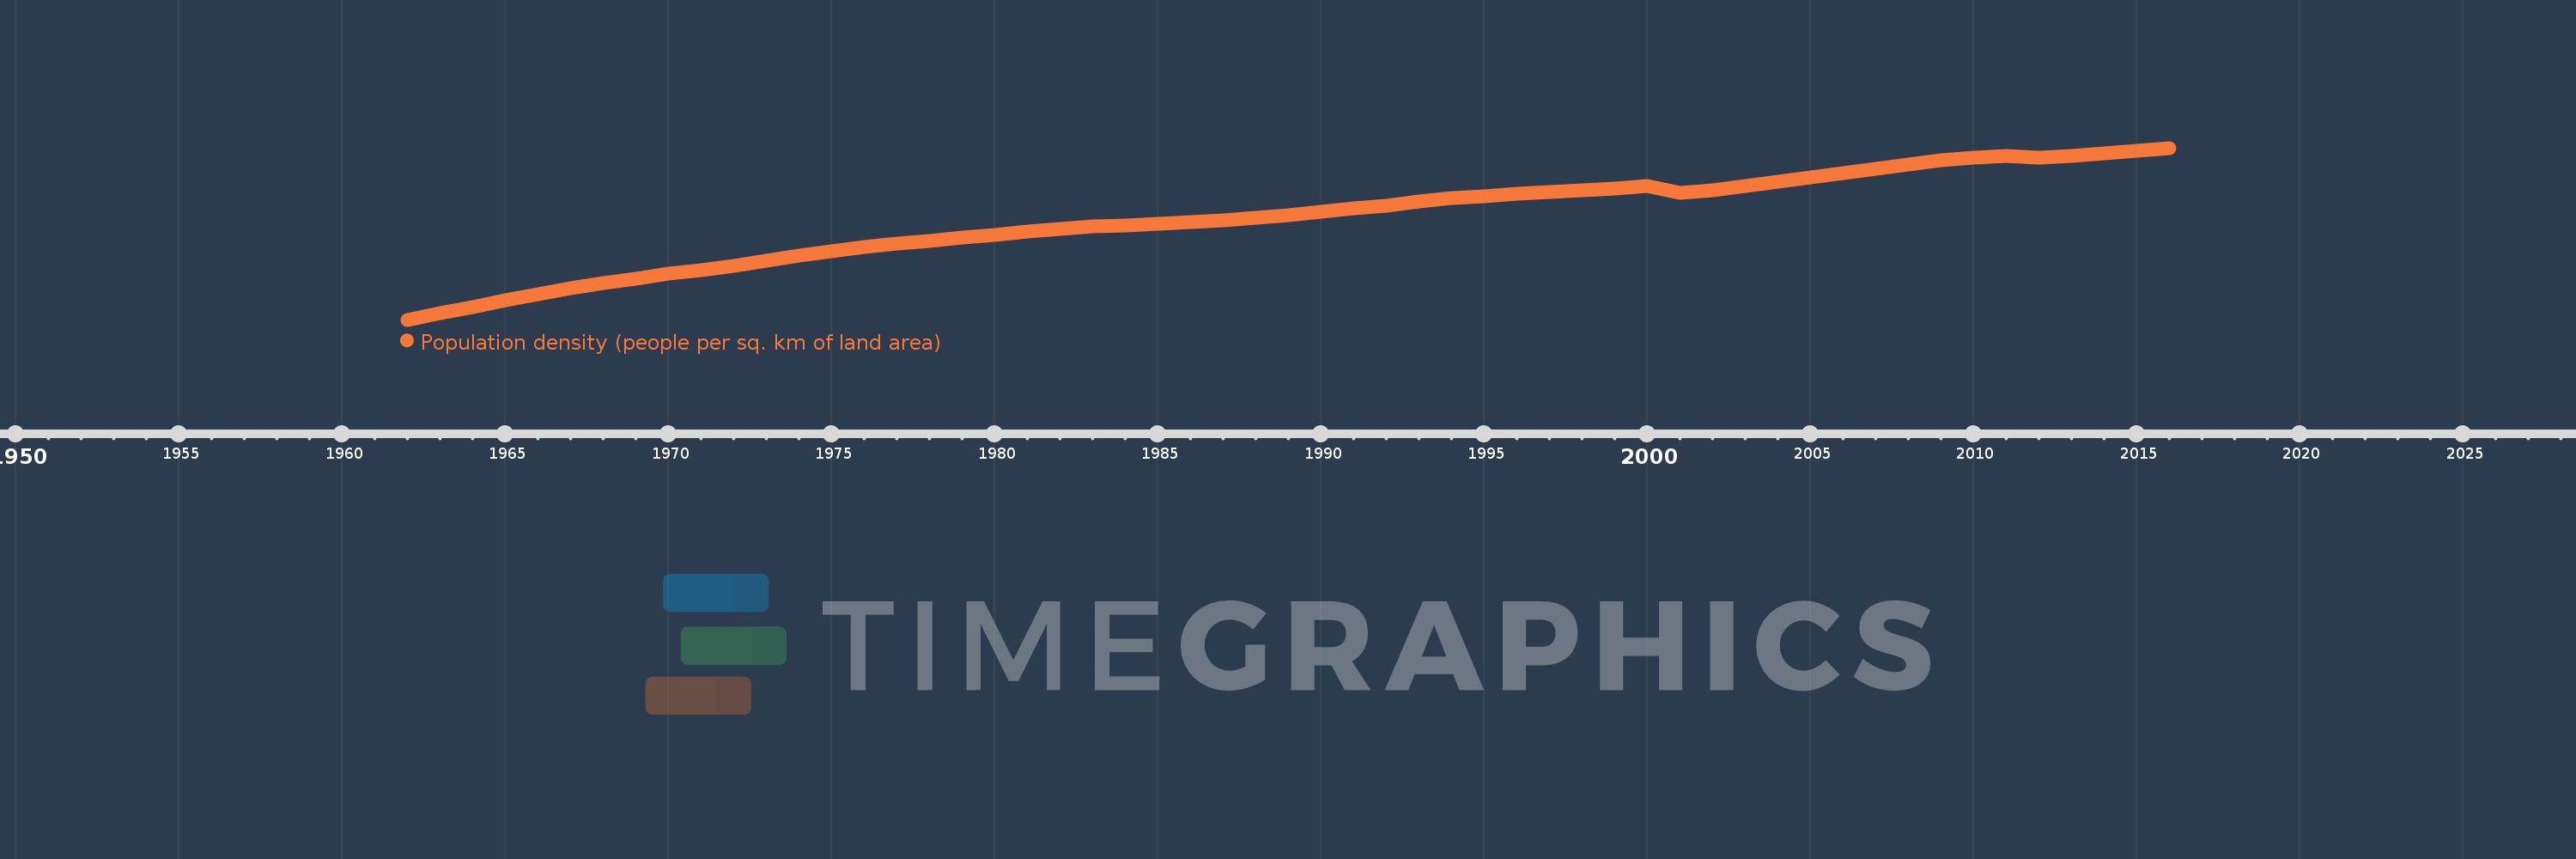
Population density (people per sq. km of land area)
2016,2015,2014,2013,2012,2011,2010,2009,2008,2007,2006,2005,2004,2003,2002,2001,2000,1999,1998,1997,1996,1995,1994,1993,1992,1991,1990,1989,1988,1987,1986,1985,1984,1983,1982,1981,1980,1979,1978,1977,1976,1975,1974,1973,1972,1971,1970,1969,1968,1967,1966,1965,1964,1963,1962
This statistics in other country:
AfghanistanAlbaniaAlgeriaAmerican SamoaAndorraAngolaAntigua and BarbudaArab WorldArgentinaArmeniaArubaAustraliaAustriaAzerbaijanBahamas, TheBahrainBangladeshBarbadosBelarusBelgiumBelizeBeninBermudaBhutanBoliviaBosnia and HerzegovinaBotswanaBrazilBritish Virgin IslandsBrunei DarussalamBulgariaBurkina FasoBurundiCabo VerdeCambodiaCameroonCanadaCaribbean small statesCayman IslandsCentral African RepublicCentral Europe and the BalticsChadChannel IslandsChileChinaColombiaComorosCongo, Dem. Rep.Congo, Rep.Costa RicaCote d'IvoireCroatiaCubaCuracaoCyprusCzech RepublicDenmarkDjiboutiDominicaDominican RepublicEarly-demographic dividendEast Asia & PacificEast Asia & Pacific (excluding high income)East Asia & Pacific (IDA & IBRD countries)EcuadorEgypt, Arab Rep.El SalvadorEquatorial GuineaEritreaEstoniaEthiopiaEuro areaEurope & Central AsiaEurope & Central Asia (excluding high income)Europe & Central Asia (IDA & IBRD countries)European UnionFaroe IslandsFijiFinlandFragile and conflict affected situationsFranceFrench PolynesiaGabonGambia, TheGeorgiaGermanyGhanaGibraltarGreeceGreenlandGrenadaGuamGuatemalaGuineaGuinea-BissauGuyanaHaitiHeavily indebted poor countries (HIPC)High incomeHondurasHong Kong SAR, ChinaHungaryIBRD onlyIcelandIDA & IBRD totalIDA blendIDA onlyIDA totalIndiaIndonesiaIran, Islamic Rep.IraqIrelandIsle of ManIsraelItalyJamaicaJapanJordanKazakhstanKenyaKiribatiKorea, Dem. People’s Rep.Korea, Rep.KosovoKuwaitKyrgyz RepublicLao PDRLate-demographic dividendLatin America & Caribbean Latin America & Caribbean (excluding high income)Latin America & the Caribbean (IDA & IBRD countries)LatviaLeast developed countries: UN classificationLebanonLesothoLiberiaLibyaLiechtensteinLithuaniaLow & middle incomeLow incomeLower middle incomeLuxembourgMacao SAR, ChinaMacedonia, FYRMadagascarMalawiMalaysiaMaldivesMaliMaltaMarshall IslandsMauritaniaMauritiusMexicoMicronesia, Fed. Sts.Middle East & North AfricaMiddle East & North Africa (excluding high income)Middle East & North Africa (IDA & IBRD countries)Middle incomeMoldovaMonacoMongoliaMontenegroMoroccoMozambiqueMyanmarNamibiaNauruNepalNetherlandsNew CaledoniaNew ZealandNicaraguaNigerNigeriaNorth AmericaNorthern Mariana IslandsNorwayOECD membersOmanOther small statesPacific island small statesPakistanPalauPanamaPapua New GuineaParaguayPeruPhilippinesPolandPortugalPost-demographic dividendPre-demographic dividendPuerto RicoQatarRomaniaRussian FederationRwandaSamoaSan MarinoSao Tome and PrincipeSaudi ArabiaSenegalSerbiaSeychellesSierra LeoneSingaporeSint Maarten (Dutch part)Slovak RepublicSloveniaSmall statesSolomon IslandsSomaliaSouth AfricaSouth AsiaSouth Asia (IDA & IBRD)SpainSri LankaSt. Kitts and NevisSt. LuciaSt. Martin (French part)St. Vincent and the GrenadinesSub-Saharan Africa Sub-Saharan Africa (excluding high income)Sub-Saharan Africa (IDA & IBRD countries)SudanSurinameSwazilandSwedenSwitzerlandSyrian Arab RepublicTajikistanTanzaniaThailandTimor-LesteTogoTongaTrinidad and TobagoTunisiaTurkeyTurkmenistanTurks and Caicos IslandsTuvaluUgandaUkraineUnited Arab EmiratesUnited KingdomUnited StatesUpper middle incomeUruguayUzbekistanVanuatuVenezuela, RBVietnamVirgin Islands (U.S.)West Bank and GazaWorldYemen, Rep.ZambiaZimbabwe Timeline:
This timeline shows a graph from 1962 to 2016 of Euro area. No data until 1961. Number of actual observations by date: 55.
Source name:
World Development Indicators
Source organization:
Food and Agriculture Organization and World Bank population estimates.
Categories, topics:
Urban Development
Last updated:
apr 23, 2017
Indicators value changes by year
Minimum:
101.224
jan 1, 1962
Maximum:
126.718
jan 1, 2016
At the date of observation
Value
Absolute change
Change from previous value
jan 1, 1962
101.224
+101.224
0.0%
jan 1, 1963
102.169
+0.945
0.93%
jan 1, 1964
103.133
+0.964
0.94%
jan 1, 1965
104.08
+0.947
0.92%
jan 1, 1966
105.015
+0.935
0.9%
jan 1, 1967
105.881
+0.866
0.82%
jan 1, 1968
106.624
+0.743
0.7%
jan 1, 1969
107.325
+0.7
0.66%
jan 1, 1970
108.038
+0.714
0.66%
jan 1, 1971
108.628
+0.59
0.55%
jan 1, 1972
109.239
+0.611
0.56%
jan 1, 1973
109.998
+0.759
0.69%
jan 1, 1974
110.724
+0.726
0.66%
jan 1, 1975
111.378
+0.654
0.59%
jan 1, 1976
111.971
+0.593
0.53%
jan 1, 1977
112.476
+0.505
0.45%
jan 1, 1978
112.918
+0.442
0.39%
jan 1, 1979
113.36
+0.443
0.39%
jan 1, 1980
113.81
+0.45
0.4%
jan 1, 1981
114.291
+0.481
0.42%
jan 1, 1982
114.72
+0.43
0.38%
jan 1, 1983
115.029
+0.308
0.27%
jan 1, 1984
115.259
+0.23
0.2%
jan 1, 1985
115.452
+0.193
0.17%
jan 1, 1986
115.674
+0.222
0.19%
jan 1, 1987
115.968
+0.294
0.25%
jan 1, 1988
116.297
+0.329
0.28%
jan 1, 1989
116.697
+0.4
0.34%
jan 1, 1990
117.209
+0.512
0.44%
jan 1, 1991
117.761
+0.552
0.47%
jan 1, 1992
118.202
+0.442
0.38%
jan 1, 1993
118.752
+0.55
0.46%
jan 1, 1994
119.239
+0.487
0.41%
jan 1, 1995
119.586
+0.347
0.29%
jan 1, 1996
119.895
+0.308
0.26%
jan 1, 1997
120.206
+0.311
0.26%
jan 1, 1998
120.494
+0.289
0.24%
jan 1, 1999
120.749
+0.255
0.21%
jan 1, 2000
121.06
+0.31
0.26%
jan 1, 2001
119.991
-1.068
-0.88%
jan 1, 2002
120.478
+0.486
0.41%
jan 1, 2003
121.046
+0.568
0.47%
jan 1, 2004
121.683
+0.637
0.53%
jan 1, 2005
122.371
+0.688
0.57%
jan 1, 2006
123.012
+0.64
0.52%
jan 1, 2007
123.616
+0.604
0.49%
jan 1, 2008
124.255
+0.639
0.52%
jan 1, 2009
124.888
+0.633
0.51%
jan 1, 2010
125.297
+0.409
0.33%
jan 1, 2011
125.528
+0.231
0.18%
jan 1, 2012
125.268
-0.261
-0.21%
jan 1, 2013
125.532
+0.265
0.21%
jan 1, 2014
125.931
+0.399
0.32%
jan 1, 2015
126.351
+0.42
0.33%
jan 1, 2016
126.718
+0.367
0.29%
Ranking of countries by current statistics by years


Comments: