29
/
en
AIzaSyAYiBZKx7MnpbEhh9jyipgxe19OcubqV5w
April 1, 2024
129774
Estonia
EST
true
2
1
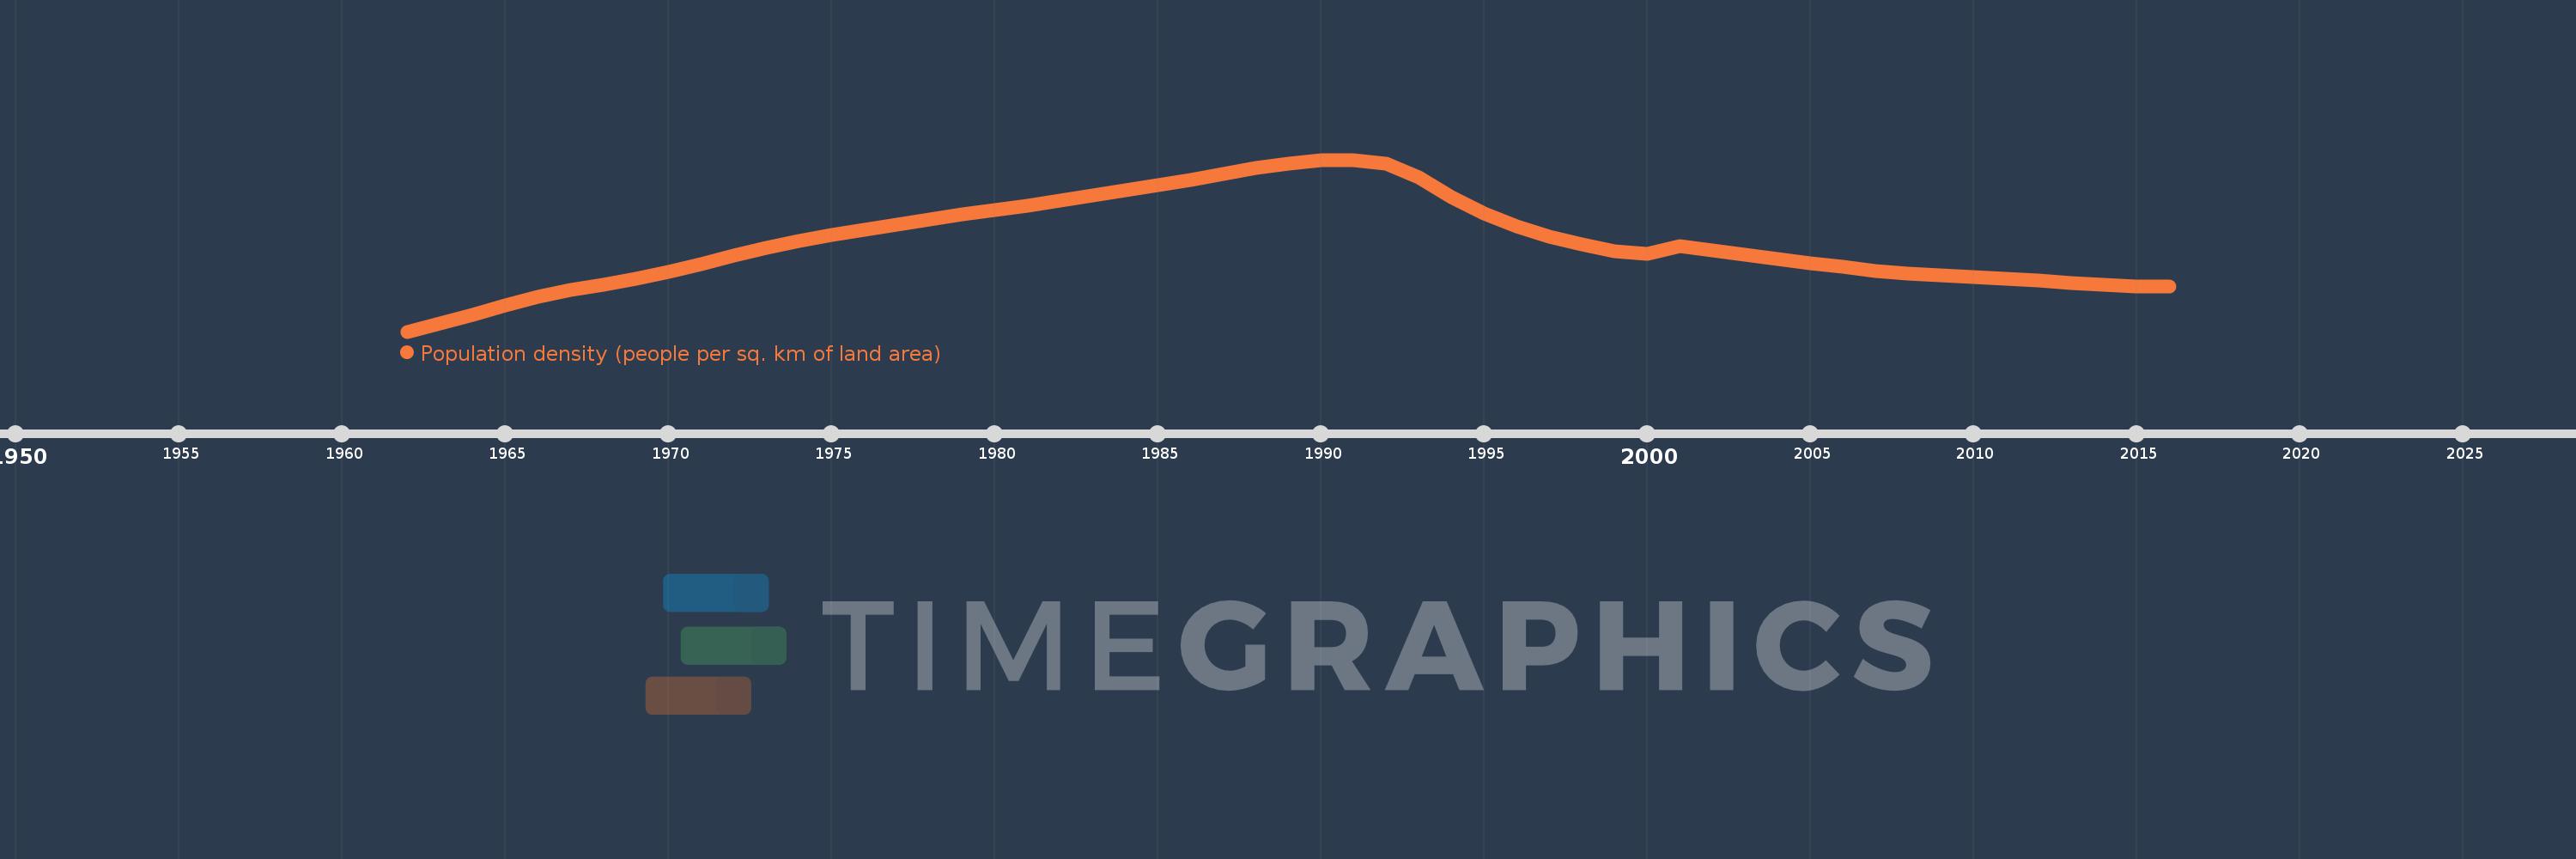
Population density (people per sq. km of land area)
2016,2015,2014,2013,2012,2011,2010,2009,2008,2007,2006,2005,2004,2003,2002,2001,2000,1999,1998,1997,1996,1995,1994,1993,1992,1991,1990,1989,1988,1987,1986,1985,1984,1983,1982,1981,1980,1979,1978,1977,1976,1975,1974,1973,1972,1971,1970,1969,1968,1967,1966,1965,1964,1963,1962
This statistics in other country:
AfghanistanAlbaniaAlgeriaAmerican SamoaAndorraAngolaAntigua and BarbudaArab WorldArgentinaArmeniaArubaAustraliaAustriaAzerbaijanBahamas, TheBahrainBangladeshBarbadosBelarusBelgiumBelizeBeninBermudaBhutanBoliviaBosnia and HerzegovinaBotswanaBrazilBritish Virgin IslandsBrunei DarussalamBulgariaBurkina FasoBurundiCabo VerdeCambodiaCameroonCanadaCaribbean small statesCayman IslandsCentral African RepublicCentral Europe and the BalticsChadChannel IslandsChileChinaColombiaComorosCongo, Dem. Rep.Congo, Rep.Costa RicaCote d'IvoireCroatiaCubaCuracaoCyprusCzech RepublicDenmarkDjiboutiDominicaDominican RepublicEarly-demographic dividendEast Asia & PacificEast Asia & Pacific (excluding high income)East Asia & Pacific (IDA & IBRD countries)EcuadorEgypt, Arab Rep.El SalvadorEquatorial GuineaEritreaEstoniaEthiopiaEuro areaEurope & Central AsiaEurope & Central Asia (excluding high income)Europe & Central Asia (IDA & IBRD countries)European UnionFaroe IslandsFijiFinlandFragile and conflict affected situationsFranceFrench PolynesiaGabonGambia, TheGeorgiaGermanyGhanaGibraltarGreeceGreenlandGrenadaGuamGuatemalaGuineaGuinea-BissauGuyanaHaitiHeavily indebted poor countries (HIPC)High incomeHondurasHong Kong SAR, ChinaHungaryIBRD onlyIcelandIDA & IBRD totalIDA blendIDA onlyIDA totalIndiaIndonesiaIran, Islamic Rep.IraqIrelandIsle of ManIsraelItalyJamaicaJapanJordanKazakhstanKenyaKiribatiKorea, Dem. People’s Rep.Korea, Rep.KosovoKuwaitKyrgyz RepublicLao PDRLate-demographic dividendLatin America & Caribbean Latin America & Caribbean (excluding high income)Latin America & the Caribbean (IDA & IBRD countries)LatviaLeast developed countries: UN classificationLebanonLesothoLiberiaLibyaLiechtensteinLithuaniaLow & middle incomeLow incomeLower middle incomeLuxembourgMacao SAR, ChinaMacedonia, FYRMadagascarMalawiMalaysiaMaldivesMaliMaltaMarshall IslandsMauritaniaMauritiusMexicoMicronesia, Fed. Sts.Middle East & North AfricaMiddle East & North Africa (excluding high income)Middle East & North Africa (IDA & IBRD countries)Middle incomeMoldovaMonacoMongoliaMontenegroMoroccoMozambiqueMyanmarNamibiaNauruNepalNetherlandsNew CaledoniaNew ZealandNicaraguaNigerNigeriaNorth AmericaNorthern Mariana IslandsNorwayOECD membersOmanOther small statesPacific island small statesPakistanPalauPanamaPapua New GuineaParaguayPeruPhilippinesPolandPortugalPost-demographic dividendPre-demographic dividendPuerto RicoQatarRomaniaRussian FederationRwandaSamoaSan MarinoSao Tome and PrincipeSaudi ArabiaSenegalSerbiaSeychellesSierra LeoneSingaporeSint Maarten (Dutch part)Slovak RepublicSloveniaSmall statesSolomon IslandsSomaliaSouth AfricaSouth AsiaSouth Asia (IDA & IBRD)SpainSri LankaSt. Kitts and NevisSt. LuciaSt. Martin (French part)St. Vincent and the GrenadinesSub-Saharan Africa Sub-Saharan Africa (excluding high income)Sub-Saharan Africa (IDA & IBRD countries)SudanSurinameSwazilandSwedenSwitzerlandSyrian Arab RepublicTajikistanTanzaniaThailandTimor-LesteTogoTongaTrinidad and TobagoTunisiaTurkeyTurkmenistanTurks and Caicos IslandsTuvaluUgandaUkraineUnited Arab EmiratesUnited KingdomUnited StatesUpper middle incomeUruguayUzbekistanVanuatuVenezuela, RBVietnamVirgin Islands (U.S.)West Bank and GazaWorldYemen, Rep.ZambiaZimbabwe Timeline:
This timeline shows a graph from 1962 to 2016 of Estonia. No data until 1961. Number of actual observations by date: 55.
Source name:
World Development Indicators
Source organization:
Food and Agriculture Organization and World Bank population estimates.
Categories, topics:
Urban Development
Last updated:
apr 23, 2017
Indicators value changes by year
Maximum:
37.018
jan 1, 1991
At the date of observation
Value
Absolute change
Change from previous value
jan 1, 1962
28.9
+28.9
0.0%
jan 1, 1963
29.29
+0.39
1.35%
jan 1, 1964
29.697
+0.407
1.39%
jan 1, 1965
30.127
+0.43
1.45%
jan 1, 1966
30.539
+0.412
1.37%
jan 1, 1967
30.87
+0.331
1.08%
jan 1, 1968
31.115
+0.244
0.79%
jan 1, 1969
31.404
+0.289
0.93%
jan 1, 1970
31.735
+0.331
1.05%
jan 1, 1971
32.085
+0.35
1.1%
jan 1, 1972
32.483
+0.398
1.24%
jan 1, 1973
32.85
+0.367
1.13%
jan 1, 1974
33.167
+0.317
0.96%
jan 1, 1975
33.455
+0.288
0.87%
jan 1, 1976
33.719
+0.264
0.79%
jan 1, 1977
33.96
+0.241
0.72%
jan 1, 1978
34.211
+0.251
0.74%
jan 1, 1979
34.447
+0.235
0.69%
jan 1, 1980
34.639
+0.192
0.56%
jan 1, 1981
34.848
+0.21
0.61%
jan 1, 1982
35.095
+0.246
0.71%
jan 1, 1983
35.348
+0.254
0.72%
jan 1, 1984
35.592
+0.244
0.69%
jan 1, 1985
35.825
+0.233
0.65%
jan 1, 1986
36.065
+0.24
0.67%
jan 1, 1987
36.334
+0.269
0.75%
jan 1, 1988
36.618
+0.284
0.78%
jan 1, 1989
36.846
+0.228
0.62%
jan 1, 1990
36.993
+0.147
0.4%
jan 1, 1991
37.018
+0.025
0.07%
jan 1, 1992
36.832
-0.185
-0.5%
jan 1, 1993
36.166
-0.666
-1.81%
jan 1, 1994
35.247
-0.919
-2.54%
jan 1, 1995
34.501
-0.746
-2.12%
jan 1, 1996
33.891
-0.611
-1.77%
jan 1, 1997
33.395
-0.496
-1.46%
jan 1, 1998
33.016
-0.379
-1.13%
jan 1, 1999
32.7
-0.316
-0.96%
jan 1, 2000
32.569
-0.131
-0.4%
jan 1, 2001
32.956
+0.386
1.19%
jan 1, 2002
32.746
-0.209
-0.63%
jan 1, 2003
32.54
-0.207
-0.63%
jan 1, 2004
32.336
-0.204
-0.63%
jan 1, 2005
32.143
-0.193
-0.6%
jan 1, 2006
31.96
-0.183
-0.57%
jan 1, 2007
31.772
-0.188
-0.59%
jan 1, 2008
31.627
-0.145
-0.46%
jan 1, 2009
31.543
-0.085
-0.27%
jan 1, 2010
31.482
-0.061
-0.19%
jan 1, 2011
31.41
-0.072
-0.23%
jan 1, 2012
31.315
-0.095
-0.3%
jan 1, 2013
31.203
-0.112
-0.36%
jan 1, 2014
31.092
-0.111
-0.36%
jan 1, 2015
31.011
-0.081
-0.26%
jan 1, 2016
31.012
+0.001
0.0%
Ranking of countries by current statistics by years


Comments: