29
/
en
AIzaSyAYiBZKx7MnpbEhh9jyipgxe19OcubqV5w
April 1, 2024
207243
Nepal
NPL
true
2
1
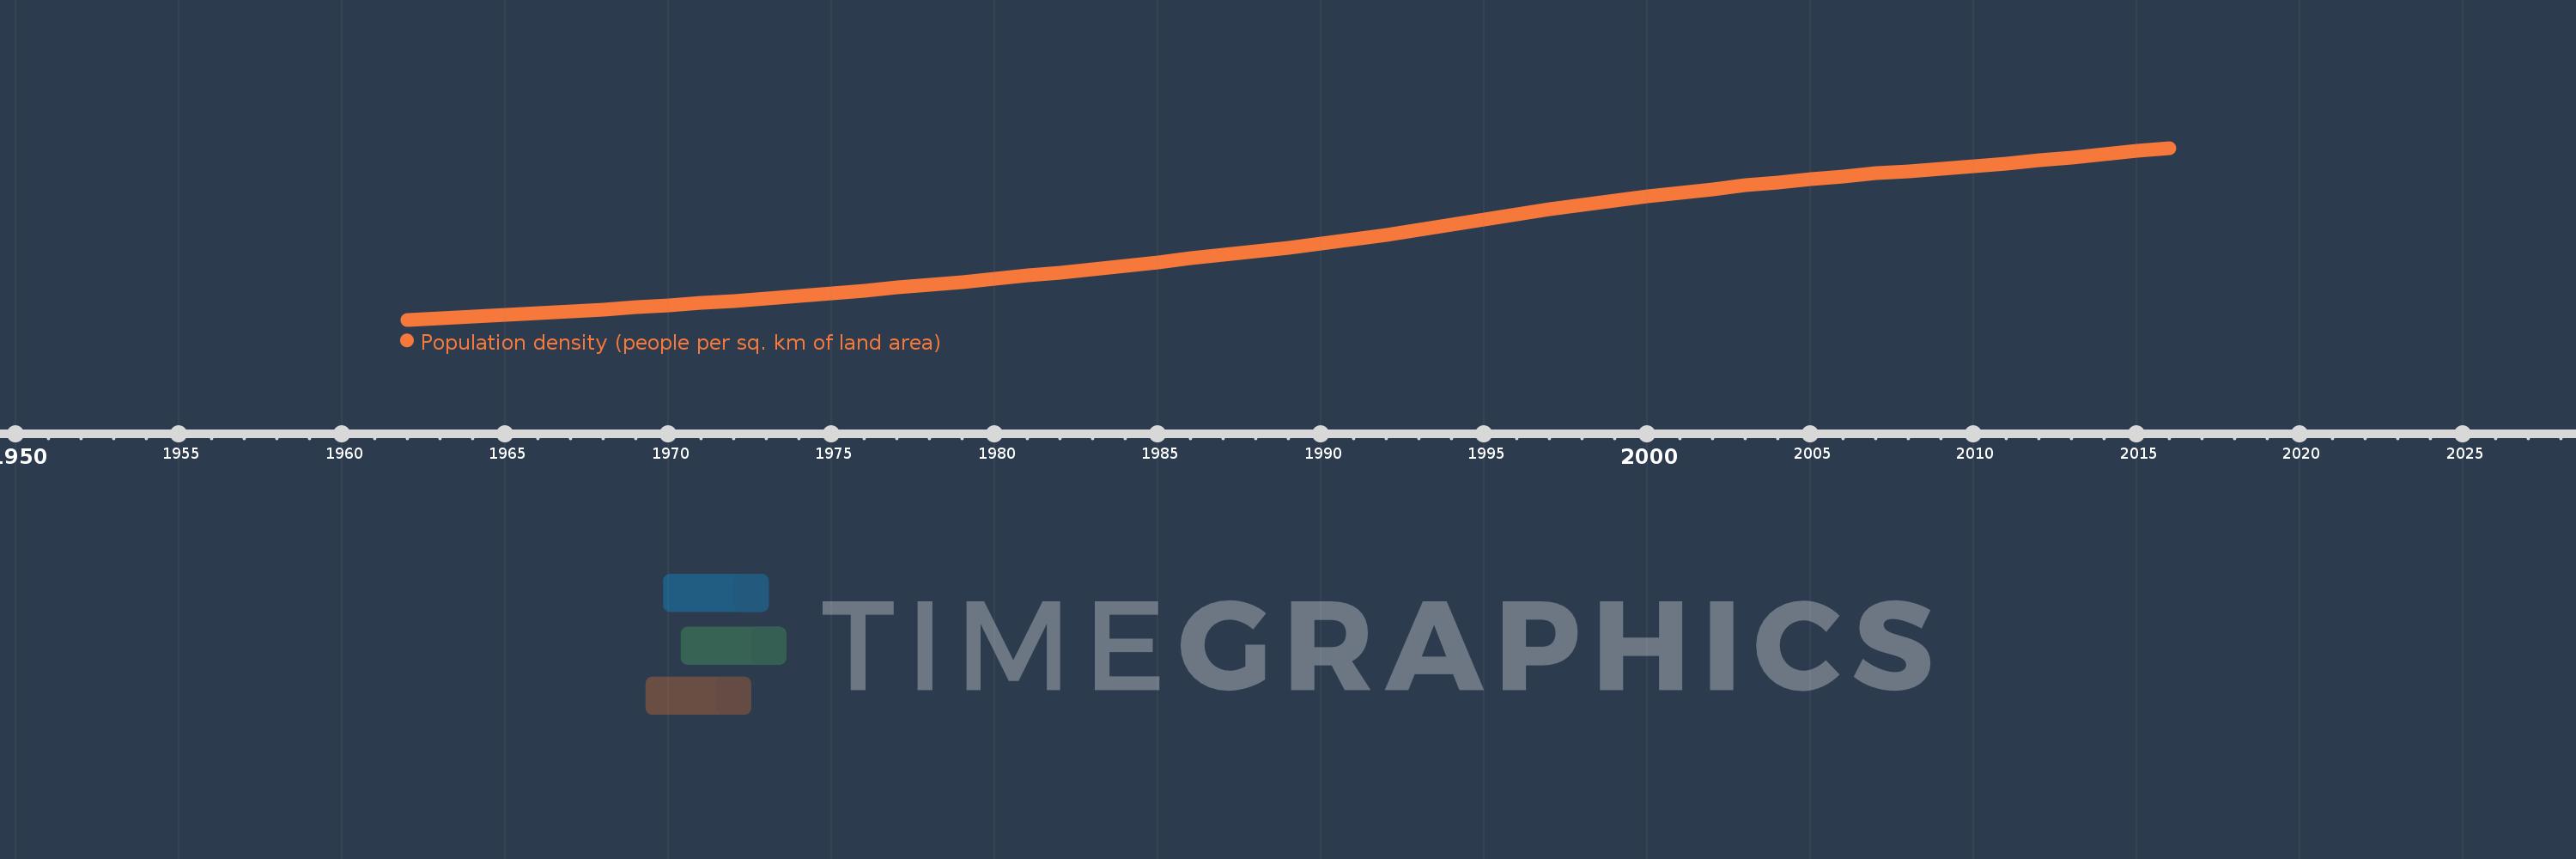
Population density (people per sq. km of land area)
2016,2015,2014,2013,2012,2011,2010,2009,2008,2007,2006,2005,2004,2003,2002,2001,2000,1999,1998,1997,1996,1995,1994,1993,1992,1991,1990,1989,1988,1987,1986,1985,1984,1983,1982,1981,1980,1979,1978,1977,1976,1975,1974,1973,1972,1971,1970,1969,1968,1967,1966,1965,1964,1963,1962
This statistics in other country:
AfghanistanAlbaniaAlgeriaAmerican SamoaAndorraAngolaAntigua and BarbudaArab WorldArgentinaArmeniaArubaAustraliaAustriaAzerbaijanBahamas, TheBahrainBangladeshBarbadosBelarusBelgiumBelizeBeninBermudaBhutanBoliviaBosnia and HerzegovinaBotswanaBrazilBritish Virgin IslandsBrunei DarussalamBulgariaBurkina FasoBurundiCabo VerdeCambodiaCameroonCanadaCaribbean small statesCayman IslandsCentral African RepublicCentral Europe and the BalticsChadChannel IslandsChileChinaColombiaComorosCongo, Dem. Rep.Congo, Rep.Costa RicaCote d'IvoireCroatiaCubaCuracaoCyprusCzech RepublicDenmarkDjiboutiDominicaDominican RepublicEarly-demographic dividendEast Asia & PacificEast Asia & Pacific (excluding high income)East Asia & Pacific (IDA & IBRD countries)EcuadorEgypt, Arab Rep.El SalvadorEquatorial GuineaEritreaEstoniaEthiopiaEuro areaEurope & Central AsiaEurope & Central Asia (excluding high income)Europe & Central Asia (IDA & IBRD countries)European UnionFaroe IslandsFijiFinlandFragile and conflict affected situationsFranceFrench PolynesiaGabonGambia, TheGeorgiaGermanyGhanaGibraltarGreeceGreenlandGrenadaGuamGuatemalaGuineaGuinea-BissauGuyanaHaitiHeavily indebted poor countries (HIPC)High incomeHondurasHong Kong SAR, ChinaHungaryIBRD onlyIcelandIDA & IBRD totalIDA blendIDA onlyIDA totalIndiaIndonesiaIran, Islamic Rep.IraqIrelandIsle of ManIsraelItalyJamaicaJapanJordanKazakhstanKenyaKiribatiKorea, Dem. People’s Rep.Korea, Rep.KosovoKuwaitKyrgyz RepublicLao PDRLate-demographic dividendLatin America & Caribbean Latin America & Caribbean (excluding high income)Latin America & the Caribbean (IDA & IBRD countries)LatviaLeast developed countries: UN classificationLebanonLesothoLiberiaLibyaLiechtensteinLithuaniaLow & middle incomeLow incomeLower middle incomeLuxembourgMacao SAR, ChinaMacedonia, FYRMadagascarMalawiMalaysiaMaldivesMaliMaltaMarshall IslandsMauritaniaMauritiusMexicoMicronesia, Fed. Sts.Middle East & North AfricaMiddle East & North Africa (excluding high income)Middle East & North Africa (IDA & IBRD countries)Middle incomeMoldovaMonacoMongoliaMontenegroMoroccoMozambiqueMyanmarNamibiaNauruNepalNetherlandsNew CaledoniaNew ZealandNicaraguaNigerNigeriaNorth AmericaNorthern Mariana IslandsNorwayOECD membersOmanOther small statesPacific island small statesPakistanPalauPanamaPapua New GuineaParaguayPeruPhilippinesPolandPortugalPost-demographic dividendPre-demographic dividendPuerto RicoQatarRomaniaRussian FederationRwandaSamoaSan MarinoSao Tome and PrincipeSaudi ArabiaSenegalSerbiaSeychellesSierra LeoneSingaporeSint Maarten (Dutch part)Slovak RepublicSloveniaSmall statesSolomon IslandsSomaliaSouth AfricaSouth AsiaSouth Asia (IDA & IBRD)SpainSri LankaSt. Kitts and NevisSt. LuciaSt. Martin (French part)St. Vincent and the GrenadinesSub-Saharan Africa Sub-Saharan Africa (excluding high income)Sub-Saharan Africa (IDA & IBRD countries)SudanSurinameSwazilandSwedenSwitzerlandSyrian Arab RepublicTajikistanTanzaniaThailandTimor-LesteTogoTongaTrinidad and TobagoTunisiaTurkeyTurkmenistanTurks and Caicos IslandsTuvaluUgandaUkraineUnited Arab EmiratesUnited KingdomUnited StatesUpper middle incomeUruguayUzbekistanVanuatuVenezuela, RBVietnamVirgin Islands (U.S.)West Bank and GazaWorldYemen, Rep.ZambiaZimbabwe Timeline:
This timeline shows a graph from 1962 to 2016 of Nepal. No data until 1961. Number of actual observations by date: 55.
Source name:
World Development Indicators
Source organization:
Food and Agriculture Organization and World Bank population estimates.
Categories, topics:
Urban Development
Last updated:
apr 23, 2017
Indicators value changes by year
Minimum:
71.435
jan 1, 1962
Maximum:
198.91
jan 1, 2016
At the date of observation
Value
Absolute change
Change from previous value
jan 1, 1962
71.435
+71.435
0.0%
jan 1, 1963
72.567
+1.132
1.58%
jan 1, 1964
73.738
+1.172
1.61%
jan 1, 1965
74.965
+1.227
1.66%
jan 1, 1966
76.259
+1.294
1.73%
jan 1, 1967
77.627
+1.368
1.79%
jan 1, 1968
79.071
+1.444
1.86%
jan 1, 1969
80.588
+1.517
1.92%
jan 1, 1970
82.174
+1.586
1.97%
jan 1, 1971
83.825
+1.651
2.01%
jan 1, 1972
85.542
+1.717
2.05%
jan 1, 1973
87.327
+1.786
2.09%
jan 1, 1974
89.182
+1.855
2.12%
jan 1, 1975
91.107
+1.925
2.16%
jan 1, 1976
93.101
+1.995
2.19%
jan 1, 1977
95.166
+2.064
2.22%
jan 1, 1978
97.299
+2.134
2.24%
jan 1, 1979
99.503
+2.204
2.27%
jan 1, 1980
101.779
+2.276
2.29%
jan 1, 1981
104.126
+2.348
2.31%
jan 1, 1982
106.555
+2.428
2.33%
jan 1, 1983
109.063
+2.508
2.35%
jan 1, 1984
111.635
+2.572
2.36%
jan 1, 1985
114.246
+2.611
2.34%
jan 1, 1986
116.883
+2.638
2.31%
jan 1, 1987
119.524
+2.641
2.26%
jan 1, 1988
122.183
+2.659
2.22%
jan 1, 1989
124.932
+2.749
2.25%
jan 1, 1990
127.87
+2.938
2.35%
jan 1, 1991
131.061
+3.191
2.5%
jan 1, 1992
134.527
+3.466
2.64%
jan 1, 1993
138.221
+3.694
2.75%
jan 1, 1994
142.047
+3.826
2.77%
jan 1, 1995
145.87
+3.823
2.69%
jan 1, 1996
149.587
+3.717
2.55%
jan 1, 1997
153.165
+3.578
2.39%
jan 1, 1998
156.61
+3.446
2.25%
jan 1, 1999
159.906
+3.295
2.1%
jan 1, 2000
163.042
+3.137
1.96%
jan 1, 2001
165.61
+2.567
1.57%
jan 1, 2002
168.406
+2.796
1.69%
jan 1, 2003
171.029
+2.623
1.56%
jan 1, 2004
173.484
+2.455
1.44%
jan 1, 2005
175.78
+2.297
1.32%
jan 1, 2006
177.934
+2.154
1.23%
jan 1, 2007
179.94
+2.006
1.13%
jan 1, 2008
181.818
+1.878
1.04%
jan 1, 2009
183.643
+1.825
1.0%
jan 1, 2010
185.509
+1.866
1.02%
jan 1, 2011
187.485
+1.976
1.07%
jan 1, 2012
189.601
+2.116
1.13%
jan 1, 2013
191.842
+2.241
1.18%
jan 1, 2014
194.175
+2.333
1.22%
jan 1, 2015
196.545
+2.37
1.22%
jan 1, 2016
198.91
+2.365
1.2%
Ranking of countries by current statistics by years


Comments: