29
/
en
AIzaSyAYiBZKx7MnpbEhh9jyipgxe19OcubqV5w
April 1, 2024
142205
Greece
GRC
true
2
1
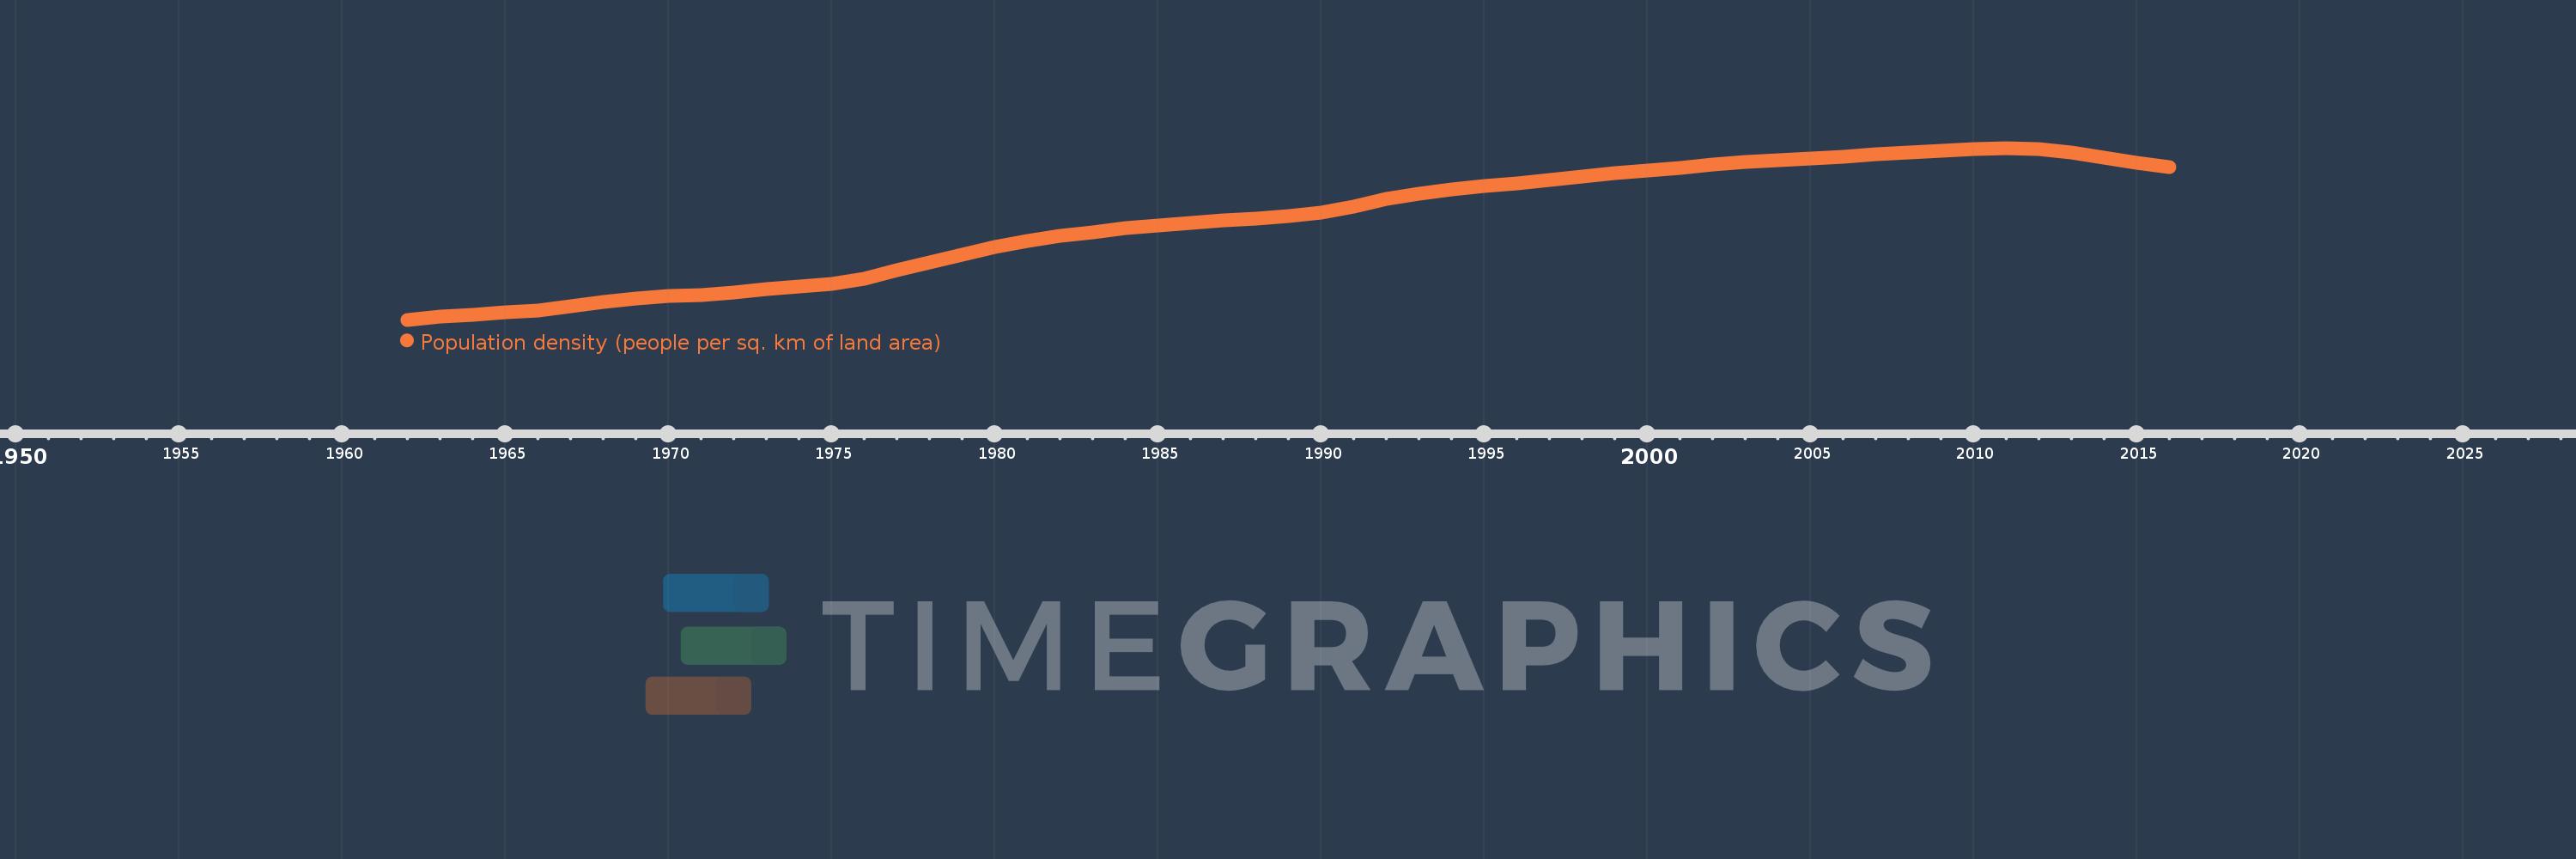
Population density (people per sq. km of land area)
2016,2015,2014,2013,2012,2011,2010,2009,2008,2007,2006,2005,2004,2003,2002,2001,2000,1999,1998,1997,1996,1995,1994,1993,1992,1991,1990,1989,1988,1987,1986,1985,1984,1983,1982,1981,1980,1979,1978,1977,1976,1975,1974,1973,1972,1971,1970,1969,1968,1967,1966,1965,1964,1963,1962
This statistics in other country:
AfghanistanAlbaniaAlgeriaAmerican SamoaAndorraAngolaAntigua and BarbudaArab WorldArgentinaArmeniaArubaAustraliaAustriaAzerbaijanBahamas, TheBahrainBangladeshBarbadosBelarusBelgiumBelizeBeninBermudaBhutanBoliviaBosnia and HerzegovinaBotswanaBrazilBritish Virgin IslandsBrunei DarussalamBulgariaBurkina FasoBurundiCabo VerdeCambodiaCameroonCanadaCaribbean small statesCayman IslandsCentral African RepublicCentral Europe and the BalticsChadChannel IslandsChileChinaColombiaComorosCongo, Dem. Rep.Congo, Rep.Costa RicaCote d'IvoireCroatiaCubaCuracaoCyprusCzech RepublicDenmarkDjiboutiDominicaDominican RepublicEarly-demographic dividendEast Asia & PacificEast Asia & Pacific (excluding high income)East Asia & Pacific (IDA & IBRD countries)EcuadorEgypt, Arab Rep.El SalvadorEquatorial GuineaEritreaEstoniaEthiopiaEuro areaEurope & Central AsiaEurope & Central Asia (excluding high income)Europe & Central Asia (IDA & IBRD countries)European UnionFaroe IslandsFijiFinlandFragile and conflict affected situationsFranceFrench PolynesiaGabonGambia, TheGeorgiaGermanyGhanaGibraltarGreeceGreenlandGrenadaGuamGuatemalaGuineaGuinea-BissauGuyanaHaitiHeavily indebted poor countries (HIPC)High incomeHondurasHong Kong SAR, ChinaHungaryIBRD onlyIcelandIDA & IBRD totalIDA blendIDA onlyIDA totalIndiaIndonesiaIran, Islamic Rep.IraqIrelandIsle of ManIsraelItalyJamaicaJapanJordanKazakhstanKenyaKiribatiKorea, Dem. People’s Rep.Korea, Rep.KosovoKuwaitKyrgyz RepublicLao PDRLate-demographic dividendLatin America & Caribbean Latin America & Caribbean (excluding high income)Latin America & the Caribbean (IDA & IBRD countries)LatviaLeast developed countries: UN classificationLebanonLesothoLiberiaLibyaLiechtensteinLithuaniaLow & middle incomeLow incomeLower middle incomeLuxembourgMacao SAR, ChinaMacedonia, FYRMadagascarMalawiMalaysiaMaldivesMaliMaltaMarshall IslandsMauritaniaMauritiusMexicoMicronesia, Fed. Sts.Middle East & North AfricaMiddle East & North Africa (excluding high income)Middle East & North Africa (IDA & IBRD countries)Middle incomeMoldovaMonacoMongoliaMontenegroMoroccoMozambiqueMyanmarNamibiaNauruNepalNetherlandsNew CaledoniaNew ZealandNicaraguaNigerNigeriaNorth AmericaNorthern Mariana IslandsNorwayOECD membersOmanOther small statesPacific island small statesPakistanPalauPanamaPapua New GuineaParaguayPeruPhilippinesPolandPortugalPost-demographic dividendPre-demographic dividendPuerto RicoQatarRomaniaRussian FederationRwandaSamoaSan MarinoSao Tome and PrincipeSaudi ArabiaSenegalSerbiaSeychellesSierra LeoneSingaporeSint Maarten (Dutch part)Slovak RepublicSloveniaSmall statesSolomon IslandsSomaliaSouth AfricaSouth AsiaSouth Asia (IDA & IBRD)SpainSri LankaSt. Kitts and NevisSt. LuciaSt. Martin (French part)St. Vincent and the GrenadinesSub-Saharan Africa Sub-Saharan Africa (excluding high income)Sub-Saharan Africa (IDA & IBRD countries)SudanSurinameSwazilandSwedenSwitzerlandSyrian Arab RepublicTajikistanTanzaniaThailandTimor-LesteTogoTongaTrinidad and TobagoTunisiaTurkeyTurkmenistanTurks and Caicos IslandsTuvaluUgandaUkraineUnited Arab EmiratesUnited KingdomUnited StatesUpper middle incomeUruguayUzbekistanVanuatuVenezuela, RBVietnamVirgin Islands (U.S.)West Bank and GazaWorldYemen, Rep.ZambiaZimbabwe Timeline:
This timeline shows a graph from 1962 to 2016 of Greece. No data until 1961. Number of actual observations by date: 55.
Source name:
World Development Indicators
Source organization:
Food and Agriculture Organization and World Bank population estimates.
Categories, topics:
Urban Development
Last updated:
apr 23, 2017
Indicators value changes by year
Minimum:
65.152
jan 1, 1962
Maximum:
86.279
jan 1, 2011
At the date of observation
Value
Absolute change
Change from previous value
jan 1, 1962
65.152
+65.152
0.0%
jan 1, 1963
65.541
+0.389
0.6%
jan 1, 1964
65.785
+0.244
0.37%
jan 1, 1965
66.023
+0.239
0.36%
jan 1, 1966
66.333
+0.31
0.47%
jan 1, 1967
66.824
+0.491
0.74%
jan 1, 1968
67.371
+0.546
0.82%
jan 1, 1969
67.81
+0.44
0.65%
jan 1, 1970
68.059
+0.248
0.37%
jan 1, 1971
68.214
+0.155
0.23%
jan 1, 1972
68.511
+0.297
0.43%
jan 1, 1973
68.958
+0.447
0.65%
jan 1, 1974
69.271
+0.314
0.46%
jan 1, 1975
69.527
+0.256
0.37%
jan 1, 1976
70.183
+0.656
0.94%
jan 1, 1977
71.281
+1.099
1.57%
jan 1, 1978
72.215
+0.934
1.31%
jan 1, 1979
73.157
+0.942
1.31%
jan 1, 1980
74.075
+0.918
1.25%
jan 1, 1981
74.806
+0.731
0.99%
jan 1, 1982
75.48
+0.674
0.9%
jan 1, 1983
75.947
+0.467
0.62%
jan 1, 1984
76.39
+0.443
0.58%
jan 1, 1985
76.771
+0.381
0.5%
jan 1, 1986
77.07
+0.299
0.39%
jan 1, 1987
77.325
+0.255
0.33%
jan 1, 1988
77.584
+0.259
0.33%
jan 1, 1989
77.866
+0.282
0.36%
jan 1, 1990
78.274
+0.407
0.52%
jan 1, 1991
79.106
+0.832
1.06%
jan 1, 1992
80.061
+0.955
1.21%
jan 1, 1993
80.675
+0.614
0.77%
jan 1, 1994
81.151
+0.476
0.59%
jan 1, 1995
81.559
+0.407
0.5%
jan 1, 1996
81.941
+0.382
0.47%
jan 1, 1997
82.303
+0.362
0.44%
jan 1, 1998
82.71
+0.407
0.49%
jan 1, 1999
83.169
+0.46
0.56%
jan 1, 2000
83.489
+0.32
0.38%
jan 1, 2001
83.831
+0.342
0.41%
jan 1, 2002
84.268
+0.437
0.52%
jan 1, 2003
84.577
+0.309
0.37%
jan 1, 2004
84.779
+0.202
0.24%
jan 1, 2005
84.989
+0.21
0.25%
jan 1, 2006
85.239
+0.25
0.29%
jan 1, 2007
85.495
+0.256
0.3%
jan 1, 2008
85.714
+0.218
0.26%
jan 1, 2009
85.941
+0.228
0.27%
jan 1, 2010
86.168
+0.226
0.26%
jan 1, 2011
86.279
+0.111
0.13%
jan 1, 2012
86.151
-0.128
-0.15%
jan 1, 2013
85.687
-0.465
-0.54%
jan 1, 2014
85.068
-0.619
-0.72%
jan 1, 2015
84.503
-0.565
-0.66%
jan 1, 2016
83.948
-0.555
-0.66%
Ranking of countries by current statistics by years


Comments: