29
/
en
AIzaSyAYiBZKx7MnpbEhh9jyipgxe19OcubqV5w
April 1, 2024
180300
Libya
LBY
true
2
1
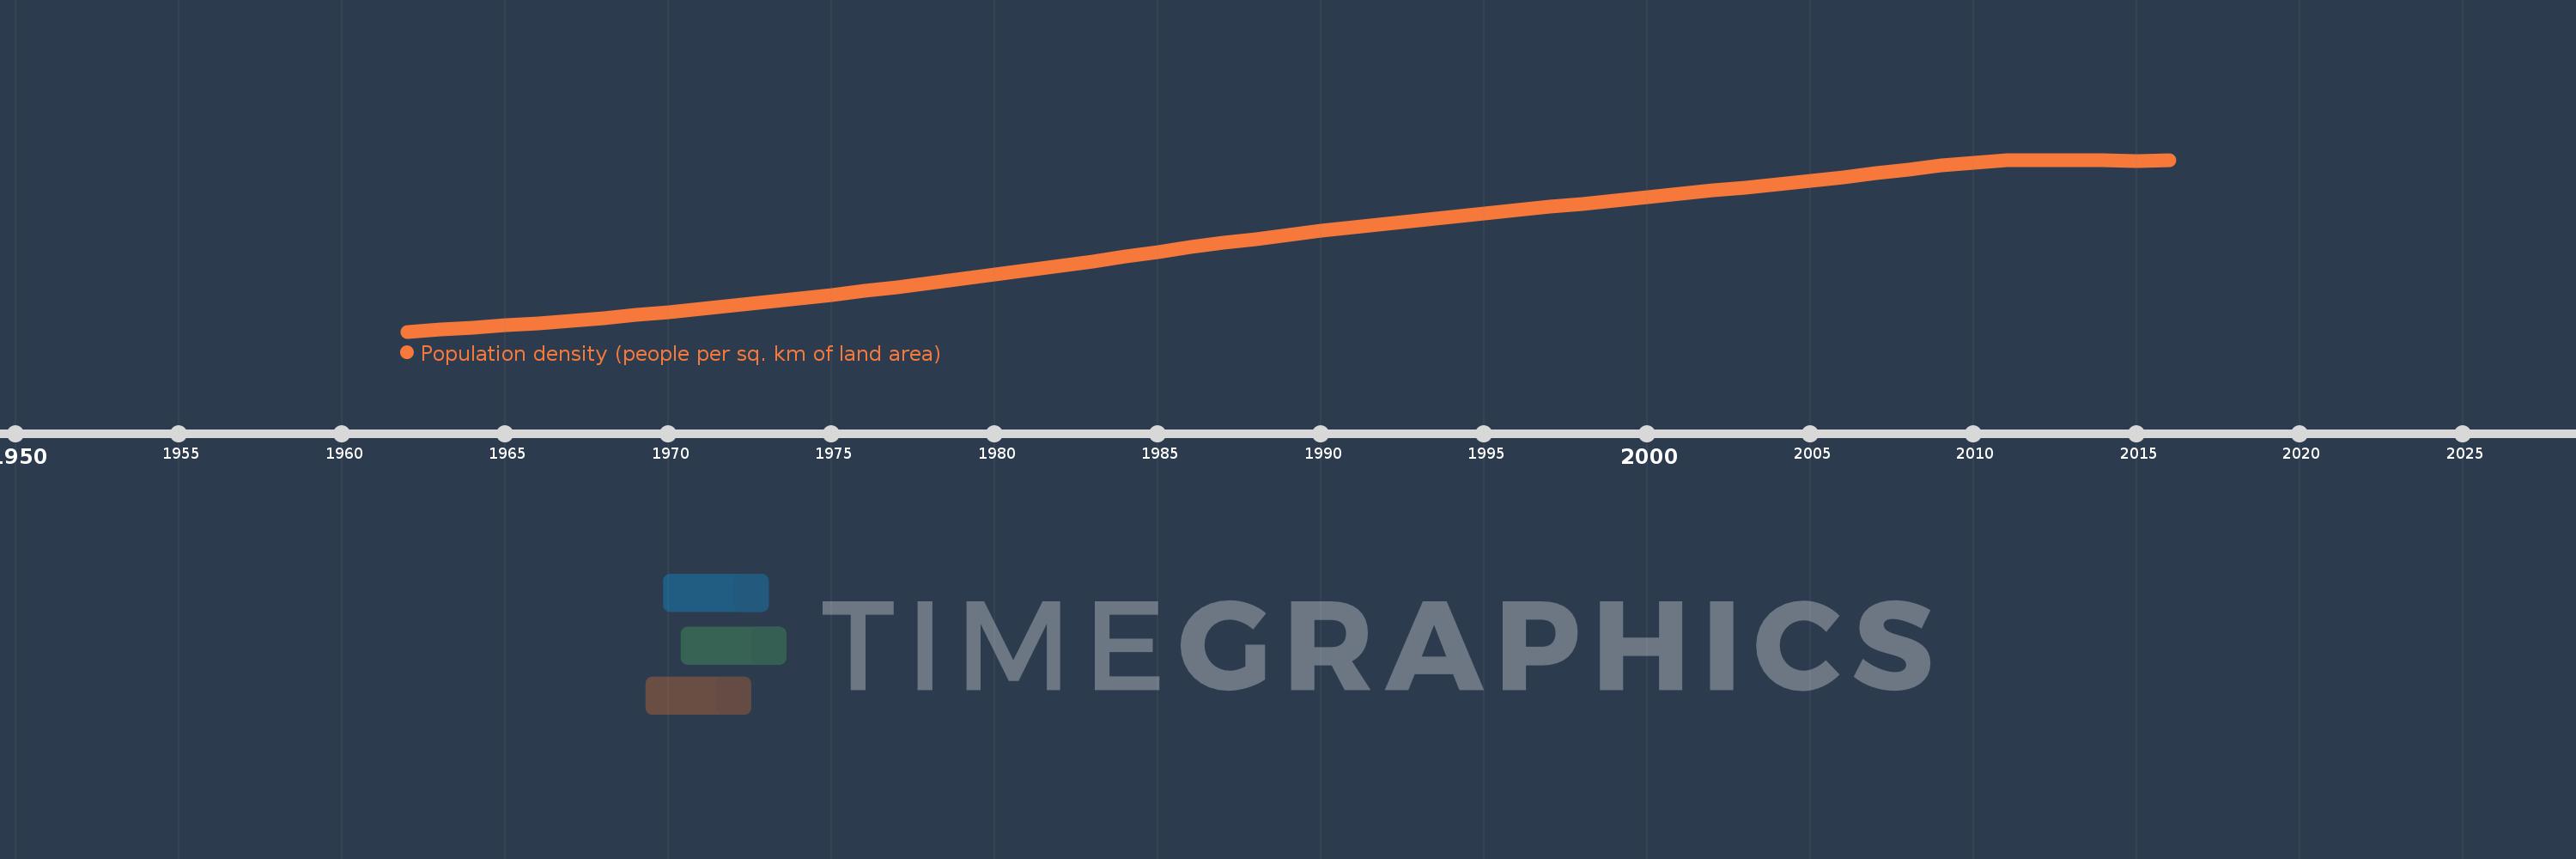
Population density (people per sq. km of land area)
2016,2015,2014,2013,2012,2011,2010,2009,2008,2007,2006,2005,2004,2003,2002,2001,2000,1999,1998,1997,1996,1995,1994,1993,1992,1991,1990,1989,1988,1987,1986,1985,1984,1983,1982,1981,1980,1979,1978,1977,1976,1975,1974,1973,1972,1971,1970,1969,1968,1967,1966,1965,1964,1963,1962
This statistics in other country:
AfghanistanAlbaniaAlgeriaAmerican SamoaAndorraAngolaAntigua and BarbudaArab WorldArgentinaArmeniaArubaAustraliaAustriaAzerbaijanBahamas, TheBahrainBangladeshBarbadosBelarusBelgiumBelizeBeninBermudaBhutanBoliviaBosnia and HerzegovinaBotswanaBrazilBritish Virgin IslandsBrunei DarussalamBulgariaBurkina FasoBurundiCabo VerdeCambodiaCameroonCanadaCaribbean small statesCayman IslandsCentral African RepublicCentral Europe and the BalticsChadChannel IslandsChileChinaColombiaComorosCongo, Dem. Rep.Congo, Rep.Costa RicaCote d'IvoireCroatiaCubaCuracaoCyprusCzech RepublicDenmarkDjiboutiDominicaDominican RepublicEarly-demographic dividendEast Asia & PacificEast Asia & Pacific (excluding high income)East Asia & Pacific (IDA & IBRD countries)EcuadorEgypt, Arab Rep.El SalvadorEquatorial GuineaEritreaEstoniaEthiopiaEuro areaEurope & Central AsiaEurope & Central Asia (excluding high income)Europe & Central Asia (IDA & IBRD countries)European UnionFaroe IslandsFijiFinlandFragile and conflict affected situationsFranceFrench PolynesiaGabonGambia, TheGeorgiaGermanyGhanaGibraltarGreeceGreenlandGrenadaGuamGuatemalaGuineaGuinea-BissauGuyanaHaitiHeavily indebted poor countries (HIPC)High incomeHondurasHong Kong SAR, ChinaHungaryIBRD onlyIcelandIDA & IBRD totalIDA blendIDA onlyIDA totalIndiaIndonesiaIran, Islamic Rep.IraqIrelandIsle of ManIsraelItalyJamaicaJapanJordanKazakhstanKenyaKiribatiKorea, Dem. People’s Rep.Korea, Rep.KosovoKuwaitKyrgyz RepublicLao PDRLate-demographic dividendLatin America & Caribbean Latin America & Caribbean (excluding high income)Latin America & the Caribbean (IDA & IBRD countries)LatviaLeast developed countries: UN classificationLebanonLesothoLiberiaLibyaLiechtensteinLithuaniaLow & middle incomeLow incomeLower middle incomeLuxembourgMacao SAR, ChinaMacedonia, FYRMadagascarMalawiMalaysiaMaldivesMaliMaltaMarshall IslandsMauritaniaMauritiusMexicoMicronesia, Fed. Sts.Middle East & North AfricaMiddle East & North Africa (excluding high income)Middle East & North Africa (IDA & IBRD countries)Middle incomeMoldovaMonacoMongoliaMontenegroMoroccoMozambiqueMyanmarNamibiaNauruNepalNetherlandsNew CaledoniaNew ZealandNicaraguaNigerNigeriaNorth AmericaNorthern Mariana IslandsNorwayOECD membersOmanOther small statesPacific island small statesPakistanPalauPanamaPapua New GuineaParaguayPeruPhilippinesPolandPortugalPost-demographic dividendPre-demographic dividendPuerto RicoQatarRomaniaRussian FederationRwandaSamoaSan MarinoSao Tome and PrincipeSaudi ArabiaSenegalSerbiaSeychellesSierra LeoneSingaporeSint Maarten (Dutch part)Slovak RepublicSloveniaSmall statesSolomon IslandsSomaliaSouth AfricaSouth AsiaSouth Asia (IDA & IBRD)SpainSri LankaSt. Kitts and NevisSt. LuciaSt. Martin (French part)St. Vincent and the GrenadinesSub-Saharan Africa Sub-Saharan Africa (excluding high income)Sub-Saharan Africa (IDA & IBRD countries)SudanSurinameSwazilandSwedenSwitzerlandSyrian Arab RepublicTajikistanTanzaniaThailandTimor-LesteTogoTongaTrinidad and TobagoTunisiaTurkeyTurkmenistanTurks and Caicos IslandsTuvaluUgandaUkraineUnited Arab EmiratesUnited KingdomUnited StatesUpper middle incomeUruguayUzbekistanVanuatuVenezuela, RBVietnamVirgin Islands (U.S.)West Bank and GazaWorldYemen, Rep.ZambiaZimbabwe Timeline:
This timeline shows a graph from 1962 to 2016 of Libya. No data until 1961. Number of actual observations by date: 55.
Source name:
World Development Indicators
Source organization:
Food and Agriculture Organization and World Bank population estimates.
Categories, topics:
Urban Development
Last updated:
apr 23, 2017
Indicators value changes by year
At the date of observation
Value
Absolute change
Change from previous value
jan 1, 1962
0.843
+0.843
0.0%
jan 1, 1963
0.873
+0.03
3.53%
jan 1, 1964
0.905
+0.032
3.64%
jan 1, 1965
0.939
+0.034
3.78%
jan 1, 1966
0.976
+0.037
3.93%
jan 1, 1967
1.016
+0.04
4.07%
jan 1, 1968
1.058
+0.042
4.17%
jan 1, 1969
1.103
+0.045
4.26%
jan 1, 1970
1.151
+0.048
4.34%
jan 1, 1971
1.202
+0.051
4.39%
jan 1, 1972
1.255
+0.053
4.44%
jan 1, 1973
1.311
+0.056
4.46%
jan 1, 1974
1.369
+0.058
4.44%
jan 1, 1975
1.429
+0.06
4.37%
jan 1, 1976
1.49
+0.061
4.27%
jan 1, 1977
1.552
+0.062
4.14%
jan 1, 1978
1.614
+0.063
4.03%
jan 1, 1979
1.678
+0.064
3.96%
jan 1, 1980
1.745
+0.066
3.95%
jan 1, 1981
1.814
+0.069
3.97%
jan 1, 1982
1.886
+0.072
3.99%
jan 1, 1983
1.961
+0.075
3.96%
jan 1, 1984
2.036
+0.076
3.86%
jan 1, 1985
2.111
+0.074
3.66%
jan 1, 1986
2.183
+0.072
3.4%
jan 1, 1987
2.251
+0.069
3.14%
jan 1, 1988
2.317
+0.066
2.92%
jan 1, 1989
2.38
+0.063
2.72%
jan 1, 1990
2.441
+0.061
2.55%
jan 1, 1991
2.5
+0.059
2.42%
jan 1, 1992
2.557
+0.057
2.29%
jan 1, 1993
2.613
+0.055
2.17%
jan 1, 1994
2.667
+0.054
2.07%
jan 1, 1995
2.72
+0.053
1.99%
jan 1, 1996
2.772
+0.053
1.94%
jan 1, 1997
2.825
+0.052
1.89%
jan 1, 1998
2.877
+0.052
1.85%
jan 1, 1999
2.929
+0.052
1.81%
jan 1, 2000
2.981
+0.052
1.78%
jan 1, 2001
3.033
+0.052
1.75%
jan 1, 2002
3.085
+0.052
1.71%
jan 1, 2003
3.136
+0.051
1.66%
jan 1, 2004
3.188
+0.052
1.65%
jan 1, 2005
3.241
+0.053
1.68%
jan 1, 2006
3.297
+0.056
1.72%
jan 1, 2007
3.357
+0.06
1.82%
jan 1, 2008
3.42
+0.063
1.87%
jan 1, 2009
3.48
+0.06
1.75%
jan 1, 2010
3.529
+0.049
1.4%
jan 1, 2011
3.561
+0.032
0.92%
jan 1, 2012
3.574
+0.013
0.37%
jan 1, 2013
3.571
-0.003
-0.08%
jan 1, 2014
3.561
-0.01
-0.28%
jan 1, 2015
3.557
-0.004
-0.11%
jan 1, 2016
3.568
+0.011
0.31%
Ranking of countries by current statistics by years


Comments: