29
/
en
AIzaSyAYiBZKx7MnpbEhh9jyipgxe19OcubqV5w
April 1, 2024
37697
IDA & IBRD total
IBT
false
2
1
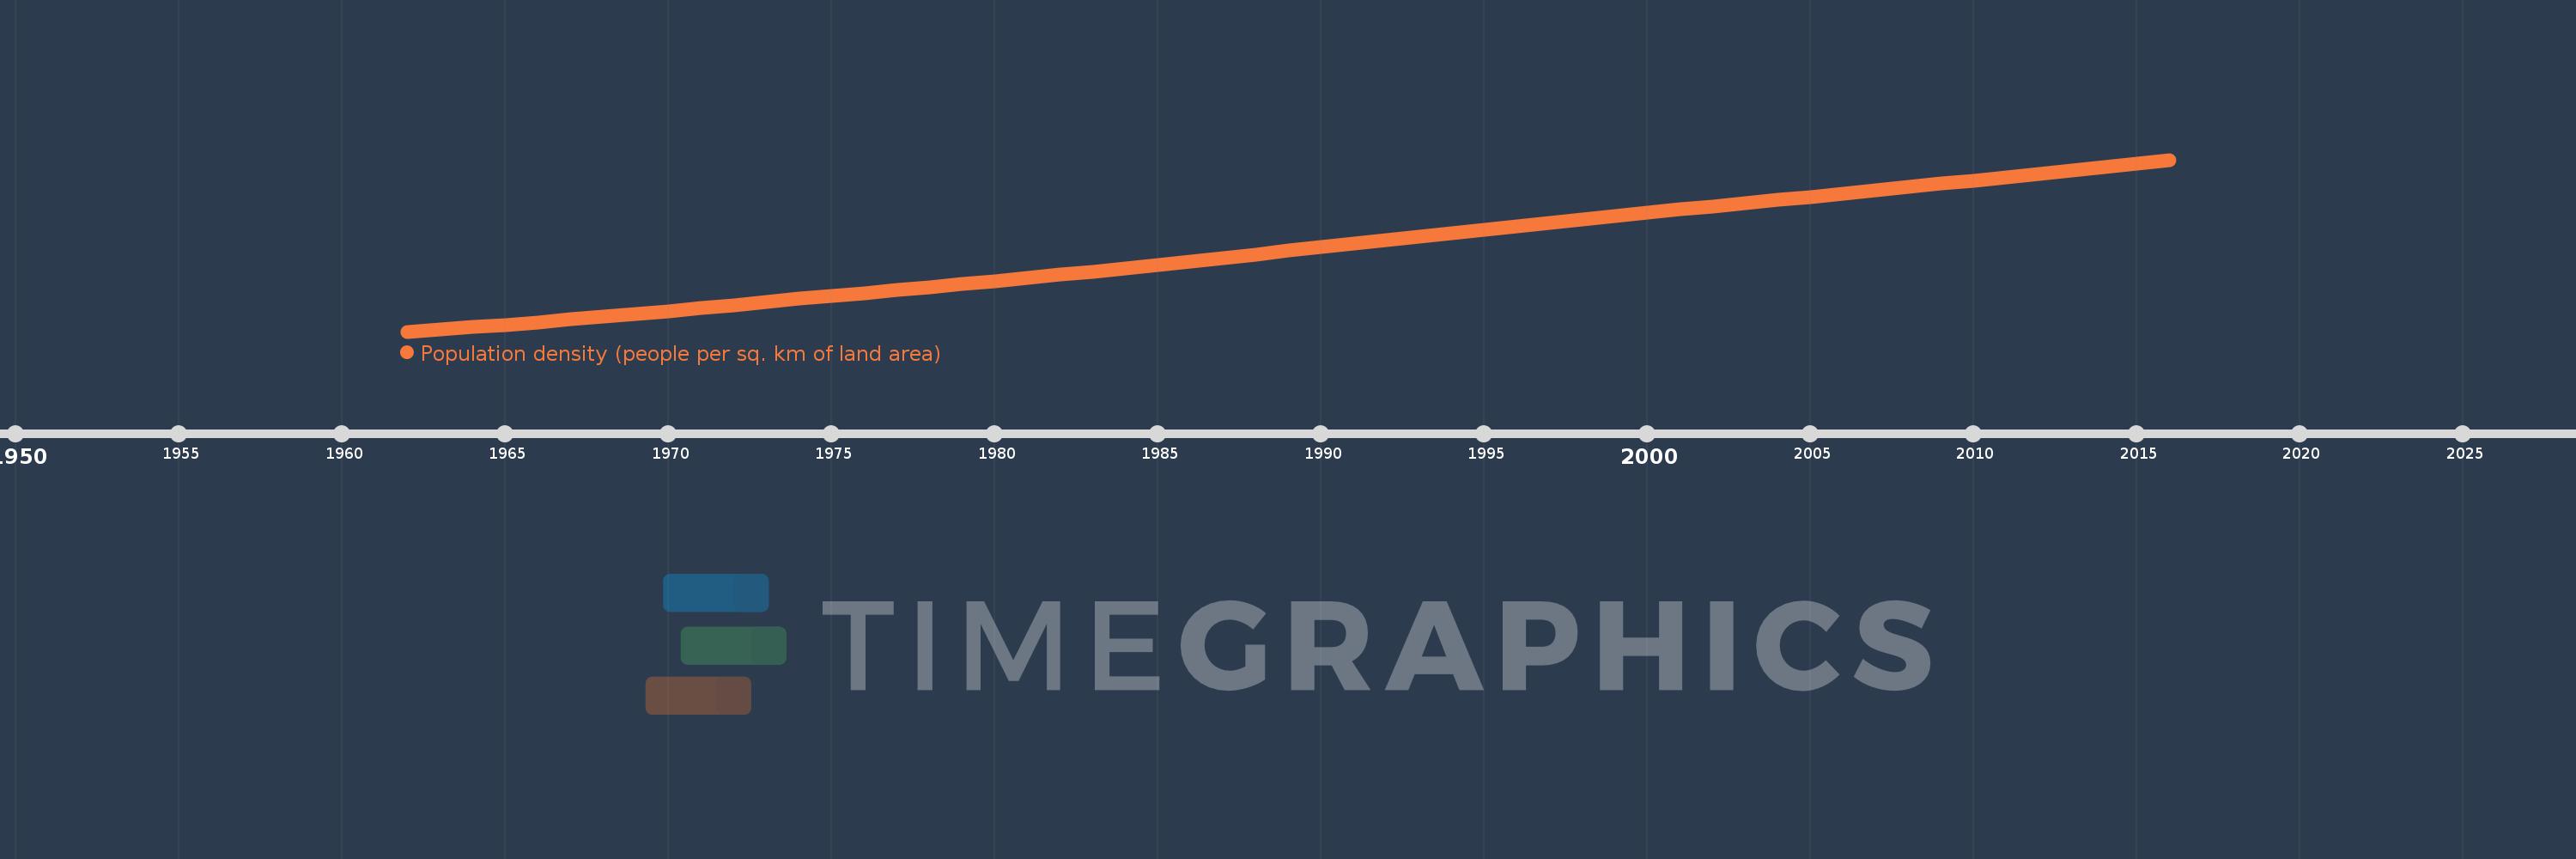
Population density (people per sq. km of land area)
2016,2015,2014,2013,2012,2011,2010,2009,2008,2007,2006,2005,2004,2003,2002,2001,2000,1999,1998,1997,1996,1995,1994,1993,1992,1991,1990,1989,1988,1987,1986,1985,1984,1983,1982,1981,1980,1979,1978,1977,1976,1975,1974,1973,1972,1971,1970,1969,1968,1967,1966,1965,1964,1963,1962
This statistics in other country:
AfghanistanAlbaniaAlgeriaAmerican SamoaAndorraAngolaAntigua and BarbudaArab WorldArgentinaArmeniaArubaAustraliaAustriaAzerbaijanBahamas, TheBahrainBangladeshBarbadosBelarusBelgiumBelizeBeninBermudaBhutanBoliviaBosnia and HerzegovinaBotswanaBrazilBritish Virgin IslandsBrunei DarussalamBulgariaBurkina FasoBurundiCabo VerdeCambodiaCameroonCanadaCaribbean small statesCayman IslandsCentral African RepublicCentral Europe and the BalticsChadChannel IslandsChileChinaColombiaComorosCongo, Dem. Rep.Congo, Rep.Costa RicaCote d'IvoireCroatiaCubaCuracaoCyprusCzech RepublicDenmarkDjiboutiDominicaDominican RepublicEarly-demographic dividendEast Asia & PacificEast Asia & Pacific (excluding high income)East Asia & Pacific (IDA & IBRD countries)EcuadorEgypt, Arab Rep.El SalvadorEquatorial GuineaEritreaEstoniaEthiopiaEuro areaEurope & Central AsiaEurope & Central Asia (excluding high income)Europe & Central Asia (IDA & IBRD countries)European UnionFaroe IslandsFijiFinlandFragile and conflict affected situationsFranceFrench PolynesiaGabonGambia, TheGeorgiaGermanyGhanaGibraltarGreeceGreenlandGrenadaGuamGuatemalaGuineaGuinea-BissauGuyanaHaitiHeavily indebted poor countries (HIPC)High incomeHondurasHong Kong SAR, ChinaHungaryIBRD onlyIcelandIDA & IBRD totalIDA blendIDA onlyIDA totalIndiaIndonesiaIran, Islamic Rep.IraqIrelandIsle of ManIsraelItalyJamaicaJapanJordanKazakhstanKenyaKiribatiKorea, Dem. People’s Rep.Korea, Rep.KosovoKuwaitKyrgyz RepublicLao PDRLate-demographic dividendLatin America & Caribbean Latin America & Caribbean (excluding high income)Latin America & the Caribbean (IDA & IBRD countries)LatviaLeast developed countries: UN classificationLebanonLesothoLiberiaLibyaLiechtensteinLithuaniaLow & middle incomeLow incomeLower middle incomeLuxembourgMacao SAR, ChinaMacedonia, FYRMadagascarMalawiMalaysiaMaldivesMaliMaltaMarshall IslandsMauritaniaMauritiusMexicoMicronesia, Fed. Sts.Middle East & North AfricaMiddle East & North Africa (excluding high income)Middle East & North Africa (IDA & IBRD countries)Middle incomeMoldovaMonacoMongoliaMontenegroMoroccoMozambiqueMyanmarNamibiaNauruNepalNetherlandsNew CaledoniaNew ZealandNicaraguaNigerNigeriaNorth AmericaNorthern Mariana IslandsNorwayOECD membersOmanOther small statesPacific island small statesPakistanPalauPanamaPapua New GuineaParaguayPeruPhilippinesPolandPortugalPost-demographic dividendPre-demographic dividendPuerto RicoQatarRomaniaRussian FederationRwandaSamoaSan MarinoSao Tome and PrincipeSaudi ArabiaSenegalSerbiaSeychellesSierra LeoneSingaporeSint Maarten (Dutch part)Slovak RepublicSloveniaSmall statesSolomon IslandsSomaliaSouth AfricaSouth AsiaSouth Asia (IDA & IBRD)SpainSri LankaSt. Kitts and NevisSt. LuciaSt. Martin (French part)St. Vincent and the GrenadinesSub-Saharan Africa Sub-Saharan Africa (excluding high income)Sub-Saharan Africa (IDA & IBRD countries)SudanSurinameSwazilandSwedenSwitzerlandSyrian Arab RepublicTajikistanTanzaniaThailandTimor-LesteTogoTongaTrinidad and TobagoTunisiaTurkeyTurkmenistanTurks and Caicos IslandsTuvaluUgandaUkraineUnited Arab EmiratesUnited KingdomUnited StatesUpper middle incomeUruguayUzbekistanVanuatuVenezuela, RBVietnamVirgin Islands (U.S.)West Bank and GazaWorldYemen, Rep.ZambiaZimbabwe Timeline:
This timeline shows a graph from 1962 to 2016 of IDA & IBRD total. No data until 1961. Number of actual observations by date: 55.
Source name:
World Development Indicators
Source organization:
Food and Agriculture Organization and World Bank population estimates.
Categories, topics:
Urban Development
Last updated:
apr 23, 2017
Indicators value changes by year
Minimum:
24.351
jan 1, 1962
Maximum:
64.605
jan 1, 2016
At the date of observation
Value
Absolute change
Change from previous value
jan 1, 1962
24.351
+24.351
0.0%
jan 1, 1963
24.801
+0.45
1.85%
jan 1, 1964
25.377
+0.577
2.33%
jan 1, 1965
25.961
+0.584
2.3%
jan 1, 1966
26.561
+0.6
2.31%
jan 1, 1967
27.198
+0.638
2.4%
jan 1, 1968
27.837
+0.638
2.35%
jan 1, 1969
28.493
+0.657
2.36%
jan 1, 1970
29.175
+0.682
2.39%
jan 1, 1971
29.875
+0.699
2.4%
jan 1, 1972
30.589
+0.715
2.39%
jan 1, 1973
31.297
+0.708
2.31%
jan 1, 1974
32.006
+0.709
2.27%
jan 1, 1975
32.711
+0.705
2.2%
jan 1, 1976
33.404
+0.693
2.12%
jan 1, 1977
34.092
+0.688
2.06%
jan 1, 1978
34.775
+0.683
2.0%
jan 1, 1979
35.469
+0.694
2.0%
jan 1, 1980
36.179
+0.71
2.0%
jan 1, 1981
36.898
+0.72
1.99%
jan 1, 1982
37.635
+0.737
2.0%
jan 1, 1983
38.407
+0.772
2.05%
jan 1, 1984
39.191
+0.784
2.04%
jan 1, 1985
39.976
+0.785
2.0%
jan 1, 1986
40.777
+0.801
2.0%
jan 1, 1987
41.603
+0.826
2.03%
jan 1, 1988
42.453
+0.849
2.04%
jan 1, 1989
43.31
+0.857
2.02%
jan 1, 1990
44.163
+0.853
1.97%
jan 1, 1991
45.002
+0.838
1.9%
jan 1, 1992
45.823
+0.821
1.82%
jan 1, 1993
46.63
+0.807
1.76%
jan 1, 1994
47.432
+0.802
1.72%
jan 1, 1995
48.231
+0.799
1.69%
jan 1, 1996
49.023
+0.792
1.64%
jan 1, 1997
49.809
+0.787
1.6%
jan 1, 1998
50.599
+0.789
1.58%
jan 1, 1999
51.395
+0.796
1.57%
jan 1, 2000
52.163
+0.768
1.49%
jan 1, 2001
52.934
+0.771
1.48%
jan 1, 2002
53.688
+0.754
1.42%
jan 1, 2003
54.437
+0.749
1.4%
jan 1, 2004
55.188
+0.751
1.38%
jan 1, 2005
55.941
+0.753
1.36%
jan 1, 2006
56.696
+0.755
1.35%
jan 1, 2007
57.454
+0.758
1.34%
jan 1, 2008
58.21
+0.756
1.32%
jan 1, 2009
58.974
+0.764
1.31%
jan 1, 2010
59.751
+0.778
1.32%
jan 1, 2011
60.535
+0.784
1.31%
jan 1, 2012
61.33
+0.795
1.31%
jan 1, 2013
62.137
+0.807
1.32%
jan 1, 2014
62.954
+0.817
1.31%
jan 1, 2015
63.778
+0.824
1.31%
jan 1, 2016
64.605
+0.827
1.3%
Ranking of countries by current statistics by years


Comments: