29
/
en
AIzaSyAYiBZKx7MnpbEhh9jyipgxe19OcubqV5w
April 1, 2024
122648
Dominican Republic
DOM
true
2
1
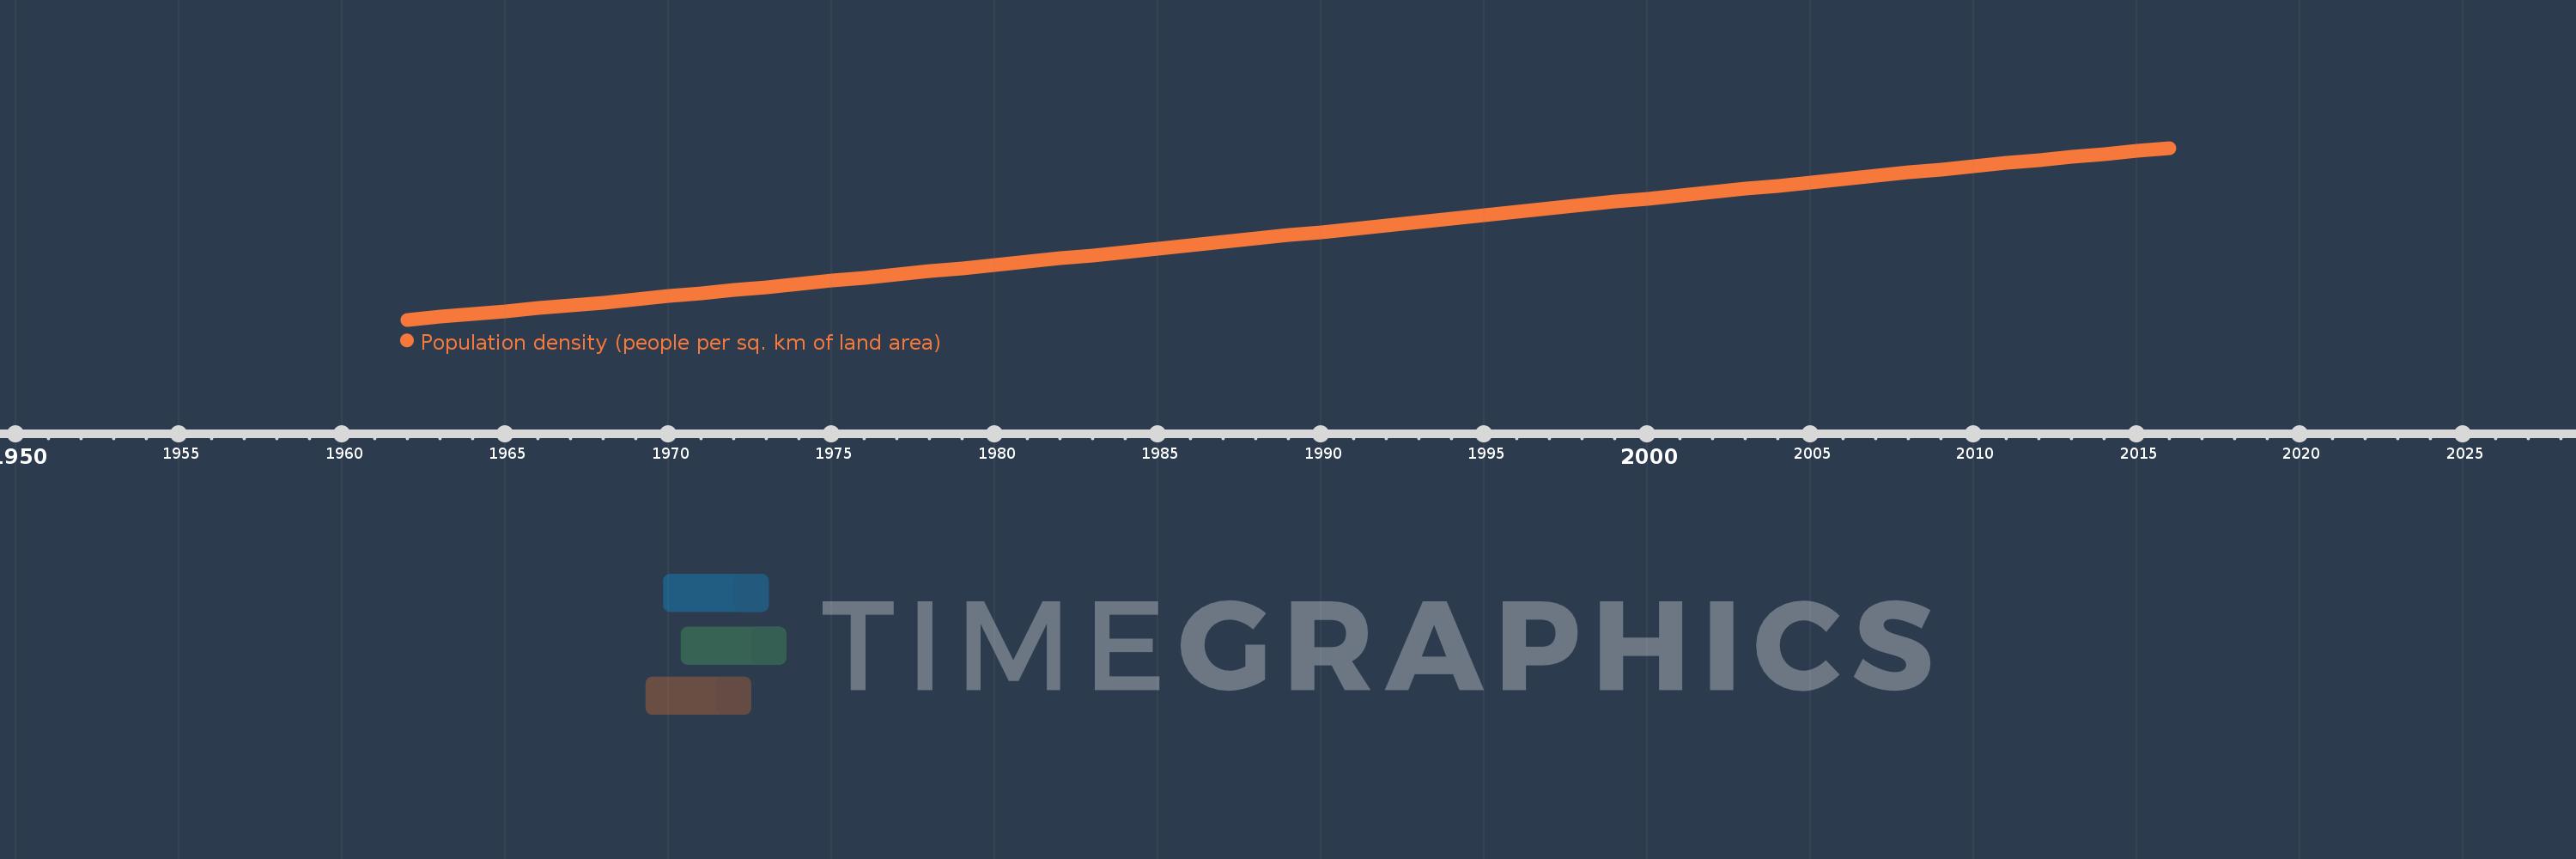
Population density (people per sq. km of land area)
2016,2015,2014,2013,2012,2011,2010,2009,2008,2007,2006,2005,2004,2003,2002,2001,2000,1999,1998,1997,1996,1995,1994,1993,1992,1991,1990,1989,1988,1987,1986,1985,1984,1983,1982,1981,1980,1979,1978,1977,1976,1975,1974,1973,1972,1971,1970,1969,1968,1967,1966,1965,1964,1963,1962
This statistics in other country:
AfghanistanAlbaniaAlgeriaAmerican SamoaAndorraAngolaAntigua and BarbudaArab WorldArgentinaArmeniaArubaAustraliaAustriaAzerbaijanBahamas, TheBahrainBangladeshBarbadosBelarusBelgiumBelizeBeninBermudaBhutanBoliviaBosnia and HerzegovinaBotswanaBrazilBritish Virgin IslandsBrunei DarussalamBulgariaBurkina FasoBurundiCabo VerdeCambodiaCameroonCanadaCaribbean small statesCayman IslandsCentral African RepublicCentral Europe and the BalticsChadChannel IslandsChileChinaColombiaComorosCongo, Dem. Rep.Congo, Rep.Costa RicaCote d'IvoireCroatiaCubaCuracaoCyprusCzech RepublicDenmarkDjiboutiDominicaDominican RepublicEarly-demographic dividendEast Asia & PacificEast Asia & Pacific (excluding high income)East Asia & Pacific (IDA & IBRD countries)EcuadorEgypt, Arab Rep.El SalvadorEquatorial GuineaEritreaEstoniaEthiopiaEuro areaEurope & Central AsiaEurope & Central Asia (excluding high income)Europe & Central Asia (IDA & IBRD countries)European UnionFaroe IslandsFijiFinlandFragile and conflict affected situationsFranceFrench PolynesiaGabonGambia, TheGeorgiaGermanyGhanaGibraltarGreeceGreenlandGrenadaGuamGuatemalaGuineaGuinea-BissauGuyanaHaitiHeavily indebted poor countries (HIPC)High incomeHondurasHong Kong SAR, ChinaHungaryIBRD onlyIcelandIDA & IBRD totalIDA blendIDA onlyIDA totalIndiaIndonesiaIran, Islamic Rep.IraqIrelandIsle of ManIsraelItalyJamaicaJapanJordanKazakhstanKenyaKiribatiKorea, Dem. People’s Rep.Korea, Rep.KosovoKuwaitKyrgyz RepublicLao PDRLate-demographic dividendLatin America & Caribbean Latin America & Caribbean (excluding high income)Latin America & the Caribbean (IDA & IBRD countries)LatviaLeast developed countries: UN classificationLebanonLesothoLiberiaLibyaLiechtensteinLithuaniaLow & middle incomeLow incomeLower middle incomeLuxembourgMacao SAR, ChinaMacedonia, FYRMadagascarMalawiMalaysiaMaldivesMaliMaltaMarshall IslandsMauritaniaMauritiusMexicoMicronesia, Fed. Sts.Middle East & North AfricaMiddle East & North Africa (excluding high income)Middle East & North Africa (IDA & IBRD countries)Middle incomeMoldovaMonacoMongoliaMontenegroMoroccoMozambiqueMyanmarNamibiaNauruNepalNetherlandsNew CaledoniaNew ZealandNicaraguaNigerNigeriaNorth AmericaNorthern Mariana IslandsNorwayOECD membersOmanOther small statesPacific island small statesPakistanPalauPanamaPapua New GuineaParaguayPeruPhilippinesPolandPortugalPost-demographic dividendPre-demographic dividendPuerto RicoQatarRomaniaRussian FederationRwandaSamoaSan MarinoSao Tome and PrincipeSaudi ArabiaSenegalSerbiaSeychellesSierra LeoneSingaporeSint Maarten (Dutch part)Slovak RepublicSloveniaSmall statesSolomon IslandsSomaliaSouth AfricaSouth AsiaSouth Asia (IDA & IBRD)SpainSri LankaSt. Kitts and NevisSt. LuciaSt. Martin (French part)St. Vincent and the GrenadinesSub-Saharan Africa Sub-Saharan Africa (excluding high income)Sub-Saharan Africa (IDA & IBRD countries)SudanSurinameSwazilandSwedenSwitzerlandSyrian Arab RepublicTajikistanTanzaniaThailandTimor-LesteTogoTongaTrinidad and TobagoTunisiaTurkeyTurkmenistanTurks and Caicos IslandsTuvaluUgandaUkraineUnited Arab EmiratesUnited KingdomUnited StatesUpper middle incomeUruguayUzbekistanVanuatuVenezuela, RBVietnamVirgin Islands (U.S.)West Bank and GazaWorldYemen, Rep.ZambiaZimbabwe Timeline:
This timeline shows a graph from 1962 to 2016 of Dominican Republic. No data until 1961. Number of actual observations by date: 55.
Source name:
World Development Indicators
Source organization:
Food and Agriculture Organization and World Bank population estimates.
Categories, topics:
Urban Development
Last updated:
apr 23, 2017
Indicators value changes by year
Minimum:
70.509
jan 1, 1962
Maximum:
217.934
jan 1, 2016
At the date of observation
Value
Absolute change
Change from previous value
jan 1, 1962
70.509
+70.509
0.0%
jan 1, 1963
72.889
+2.38
3.38%
jan 1, 1964
75.318
+2.429
3.33%
jan 1, 1965
77.788
+2.47
3.28%
jan 1, 1966
80.293
+2.504
3.22%
jan 1, 1967
82.827
+2.534
3.16%
jan 1, 1968
85.388
+2.561
3.09%
jan 1, 1969
87.974
+2.586
3.03%
jan 1, 1970
90.583
+2.609
2.97%
jan 1, 1971
93.213
+2.63
2.9%
jan 1, 1972
95.862
+2.65
2.84%
jan 1, 1973
98.529
+2.667
2.78%
jan 1, 1974
101.21
+2.681
2.72%
jan 1, 1975
103.901
+2.692
2.66%
jan 1, 1976
106.602
+2.701
2.6%
jan 1, 1977
109.309
+2.707
2.54%
jan 1, 1978
112.024
+2.715
2.48%
jan 1, 1979
114.749
+2.725
2.43%
jan 1, 1980
117.49
+2.741
2.39%
jan 1, 1981
120.25
+2.76
2.35%
jan 1, 1982
123.03
+2.78
2.31%
jan 1, 1983
125.829
+2.799
2.28%
jan 1, 1984
128.645
+2.816
2.24%
jan 1, 1985
131.475
+2.83
2.2%
jan 1, 1986
134.317
+2.842
2.16%
jan 1, 1987
137.167
+2.85
2.12%
jan 1, 1988
140.025
+2.858
2.08%
jan 1, 1989
142.896
+2.871
2.05%
jan 1, 1990
145.786
+2.89
2.02%
jan 1, 1991
148.699
+2.913
2.0%
jan 1, 1992
151.638
+2.939
1.98%
jan 1, 1993
154.596
+2.959
1.95%
jan 1, 1994
157.555
+2.958
1.91%
jan 1, 1995
160.485
+2.931
1.86%
jan 1, 1996
163.37
+2.885
1.8%
jan 1, 1997
166.2
+2.83
1.73%
jan 1, 1998
168.981
+2.781
1.67%
jan 1, 1999
171.732
+2.751
1.63%
jan 1, 2000
174.48
+2.748
1.6%
jan 1, 2001
177.243
+2.764
1.58%
jan 1, 2002
180.027
+2.784
1.57%
jan 1, 2003
182.825
+2.798
1.55%
jan 1, 2004
185.629
+2.804
1.53%
jan 1, 2005
188.429
+2.799
1.51%
jan 1, 2006
191.214
+2.786
1.48%
jan 1, 2007
193.983
+2.769
1.45%
jan 1, 2008
196.736
+2.753
1.42%
jan 1, 2009
199.472
+2.736
1.39%
jan 1, 2010
202.189
+2.717
1.36%
jan 1, 2011
204.885
+2.696
1.33%
jan 1, 2012
207.558
+2.674
1.3%
jan 1, 2013
210.206
+2.647
1.28%
jan 1, 2014
212.822
+2.616
1.24%
jan 1, 2015
215.399
+2.578
1.21%
jan 1, 2016
217.934
+2.535
1.18%
Ranking of countries by current statistics by years


Comments: