29
/
en
AIzaSyAYiBZKx7MnpbEhh9jyipgxe19OcubqV5w
April 1, 2024
163066
Jamaica
JAM
true
2
1
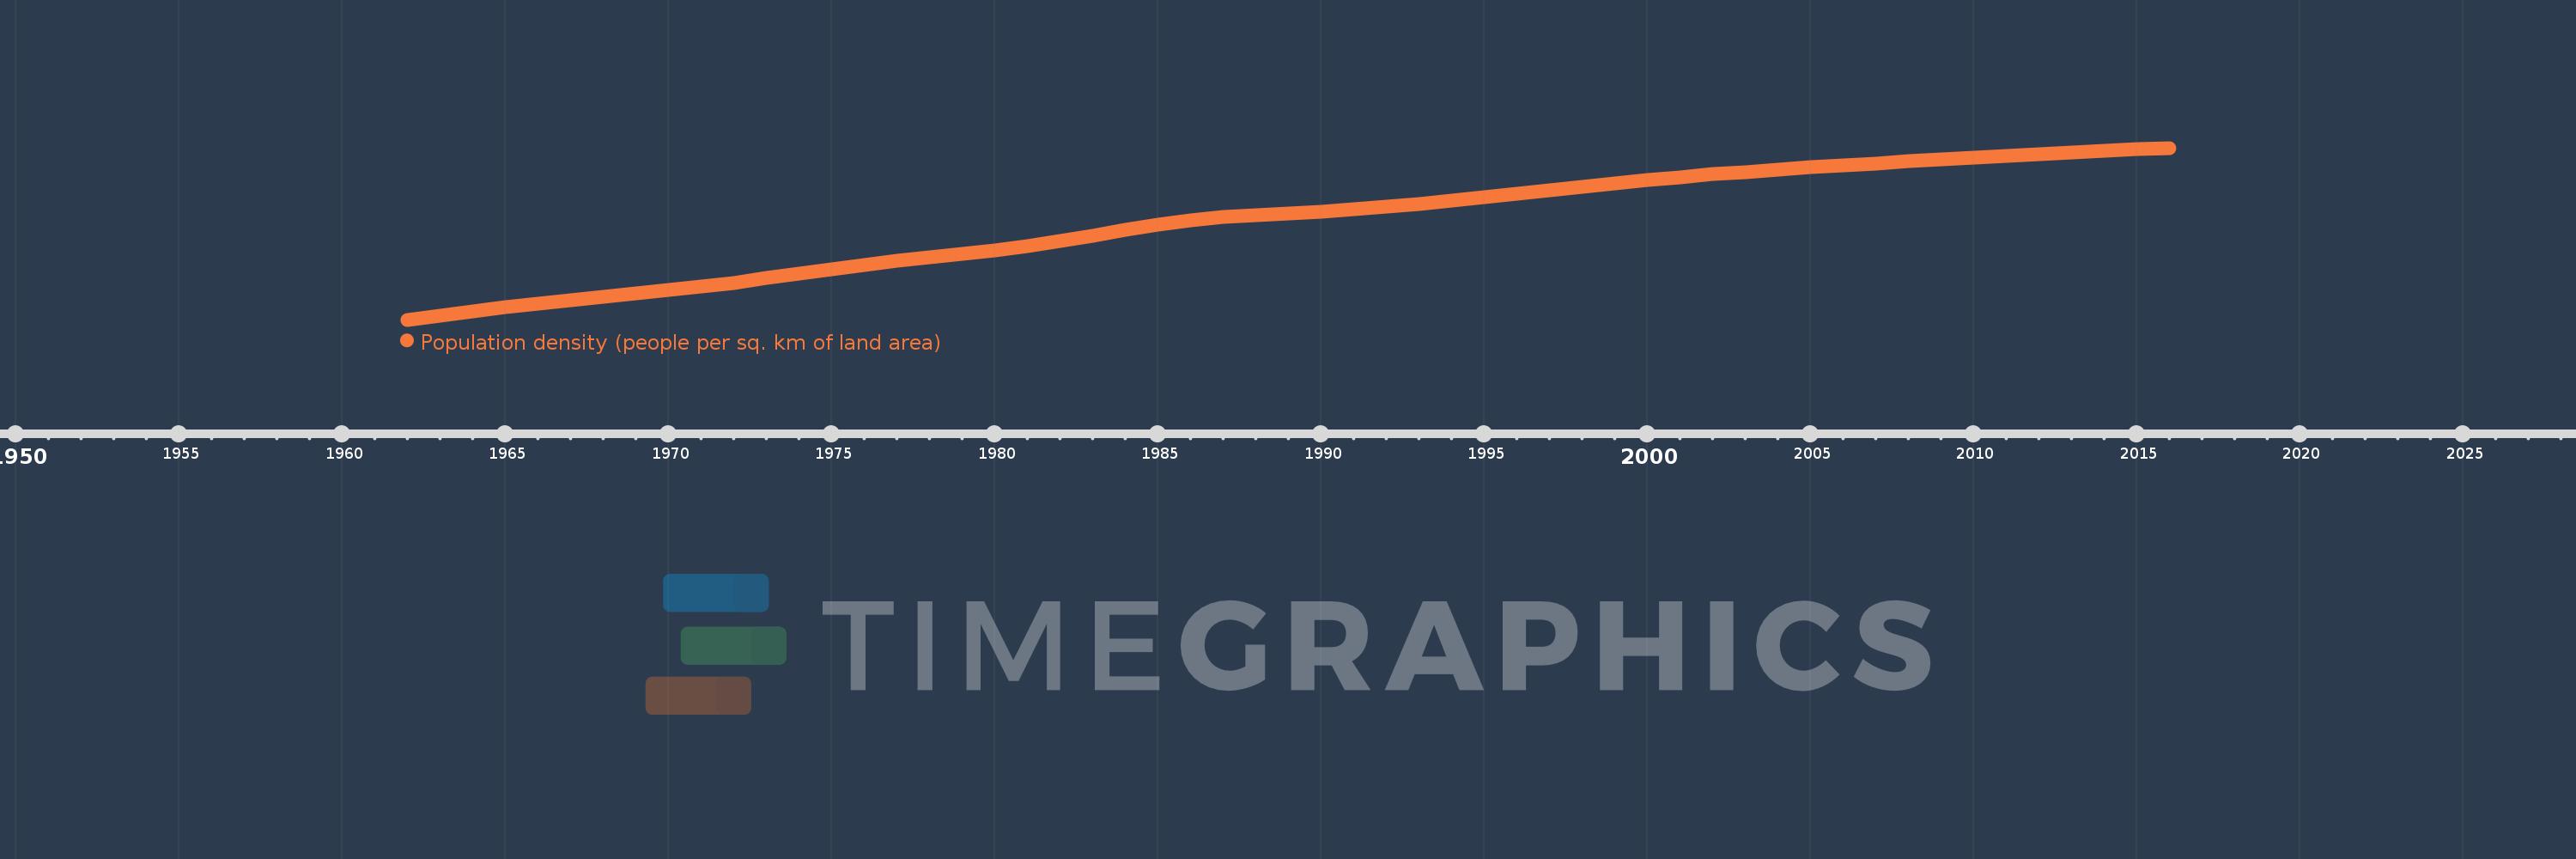
Population density (people per sq. km of land area)
2016,2015,2014,2013,2012,2011,2010,2009,2008,2007,2006,2005,2004,2003,2002,2001,2000,1999,1998,1997,1996,1995,1994,1993,1992,1991,1990,1989,1988,1987,1986,1985,1984,1983,1982,1981,1980,1979,1978,1977,1976,1975,1974,1973,1972,1971,1970,1969,1968,1967,1966,1965,1964,1963,1962
This statistics in other country:
AfghanistanAlbaniaAlgeriaAmerican SamoaAndorraAngolaAntigua and BarbudaArab WorldArgentinaArmeniaArubaAustraliaAustriaAzerbaijanBahamas, TheBahrainBangladeshBarbadosBelarusBelgiumBelizeBeninBermudaBhutanBoliviaBosnia and HerzegovinaBotswanaBrazilBritish Virgin IslandsBrunei DarussalamBulgariaBurkina FasoBurundiCabo VerdeCambodiaCameroonCanadaCaribbean small statesCayman IslandsCentral African RepublicCentral Europe and the BalticsChadChannel IslandsChileChinaColombiaComorosCongo, Dem. Rep.Congo, Rep.Costa RicaCote d'IvoireCroatiaCubaCuracaoCyprusCzech RepublicDenmarkDjiboutiDominicaDominican RepublicEarly-demographic dividendEast Asia & PacificEast Asia & Pacific (excluding high income)East Asia & Pacific (IDA & IBRD countries)EcuadorEgypt, Arab Rep.El SalvadorEquatorial GuineaEritreaEstoniaEthiopiaEuro areaEurope & Central AsiaEurope & Central Asia (excluding high income)Europe & Central Asia (IDA & IBRD countries)European UnionFaroe IslandsFijiFinlandFragile and conflict affected situationsFranceFrench PolynesiaGabonGambia, TheGeorgiaGermanyGhanaGibraltarGreeceGreenlandGrenadaGuamGuatemalaGuineaGuinea-BissauGuyanaHaitiHeavily indebted poor countries (HIPC)High incomeHondurasHong Kong SAR, ChinaHungaryIBRD onlyIcelandIDA & IBRD totalIDA blendIDA onlyIDA totalIndiaIndonesiaIran, Islamic Rep.IraqIrelandIsle of ManIsraelItalyJamaicaJapanJordanKazakhstanKenyaKiribatiKorea, Dem. People’s Rep.Korea, Rep.KosovoKuwaitKyrgyz RepublicLao PDRLate-demographic dividendLatin America & Caribbean Latin America & Caribbean (excluding high income)Latin America & the Caribbean (IDA & IBRD countries)LatviaLeast developed countries: UN classificationLebanonLesothoLiberiaLibyaLiechtensteinLithuaniaLow & middle incomeLow incomeLower middle incomeLuxembourgMacao SAR, ChinaMacedonia, FYRMadagascarMalawiMalaysiaMaldivesMaliMaltaMarshall IslandsMauritaniaMauritiusMexicoMicronesia, Fed. Sts.Middle East & North AfricaMiddle East & North Africa (excluding high income)Middle East & North Africa (IDA & IBRD countries)Middle incomeMoldovaMonacoMongoliaMontenegroMoroccoMozambiqueMyanmarNamibiaNauruNepalNetherlandsNew CaledoniaNew ZealandNicaraguaNigerNigeriaNorth AmericaNorthern Mariana IslandsNorwayOECD membersOmanOther small statesPacific island small statesPakistanPalauPanamaPapua New GuineaParaguayPeruPhilippinesPolandPortugalPost-demographic dividendPre-demographic dividendPuerto RicoQatarRomaniaRussian FederationRwandaSamoaSan MarinoSao Tome and PrincipeSaudi ArabiaSenegalSerbiaSeychellesSierra LeoneSingaporeSint Maarten (Dutch part)Slovak RepublicSloveniaSmall statesSolomon IslandsSomaliaSouth AfricaSouth AsiaSouth Asia (IDA & IBRD)SpainSri LankaSt. Kitts and NevisSt. LuciaSt. Martin (French part)St. Vincent and the GrenadinesSub-Saharan Africa Sub-Saharan Africa (excluding high income)Sub-Saharan Africa (IDA & IBRD countries)SudanSurinameSwazilandSwedenSwitzerlandSyrian Arab RepublicTajikistanTanzaniaThailandTimor-LesteTogoTongaTrinidad and TobagoTunisiaTurkeyTurkmenistanTurks and Caicos IslandsTuvaluUgandaUkraineUnited Arab EmiratesUnited KingdomUnited StatesUpper middle incomeUruguayUzbekistanVanuatuVenezuela, RBVietnamVirgin Islands (U.S.)West Bank and GazaWorldYemen, Rep.ZambiaZimbabwe Timeline:
This timeline shows a graph from 1962 to 2016 of Jamaica. No data until 1961. Number of actual observations by date: 55.
Source name:
World Development Indicators
Source organization:
Food and Agriculture Organization and World Bank population estimates.
Categories, topics:
Urban Development
Last updated:
apr 23, 2017
Indicators value changes by year
Minimum:
152.766
jan 1, 1962
Maximum:
257.926
jan 1, 2016
At the date of observation
Value
Absolute change
Change from previous value
jan 1, 1962
152.766
+152.766
0.0%
jan 1, 1963
155.237
+2.471
1.62%
jan 1, 1964
157.866
+2.629
1.69%
jan 1, 1965
160.445
+2.579
1.63%
jan 1, 1966
162.829
+2.384
1.49%
jan 1, 1967
164.963
+2.134
1.31%
jan 1, 1968
166.91
+1.948
1.18%
jan 1, 1969
168.789
+1.879
1.13%
jan 1, 1970
170.772
+1.983
1.17%
jan 1, 1971
172.978
+2.206
1.29%
jan 1, 1972
175.461
+2.483
1.44%
jan 1, 1973
178.168
+2.707
1.54%
jan 1, 1974
180.983
+2.815
1.58%
jan 1, 1975
183.738
+2.755
1.52%
jan 1, 1976
186.319
+2.581
1.4%
jan 1, 1977
188.652
+2.333
1.25%
jan 1, 1978
190.789
+2.138
1.13%
jan 1, 1979
192.892
+2.102
1.1%
jan 1, 1980
195.187
+2.296
1.19%
jan 1, 1981
197.824
+2.637
1.35%
jan 1, 1982
200.89
+3.065
1.55%
jan 1, 1983
204.284
+3.395
1.69%
jan 1, 1984
207.746
+3.462
1.69%
jan 1, 1985
210.907
+3.16
1.52%
jan 1, 1986
213.512
+2.606
1.24%
jan 1, 1987
215.46
+1.947
0.91%
jan 1, 1988
216.858
+1.398
0.65%
jan 1, 1989
217.928
+1.07
0.49%
jan 1, 1990
218.995
+1.067
0.49%
jan 1, 1991
220.296
+1.301
0.59%
jan 1, 1992
221.891
+1.595
0.72%
jan 1, 1993
223.71
+1.819
0.82%
jan 1, 1994
225.705
+1.995
0.89%
jan 1, 1995
227.784
+2.079
0.92%
jan 1, 1996
229.874
+2.09
0.92%
jan 1, 1997
231.98
+2.105
0.92%
jan 1, 1998
234.113
+2.133
0.92%
jan 1, 1999
236.218
+2.105
0.9%
jan 1, 2000
238.225
+2.007
0.85%
jan 1, 2001
240.083
+1.858
0.78%
jan 1, 2002
241.766
+1.683
0.7%
jan 1, 2003
243.285
+1.519
0.63%
jan 1, 2004
244.675
+1.389
0.57%
jan 1, 2005
245.988
+1.313
0.54%
jan 1, 2006
247.266
+1.278
0.52%
jan 1, 2007
248.517
+1.252
0.51%
jan 1, 2008
249.733
+1.215
0.49%
jan 1, 2009
250.909
+1.176
0.47%
jan 1, 2010
252.038
+1.129
0.45%
jan 1, 2011
253.117
+1.078
0.43%
jan 1, 2012
254.142
+1.025
0.41%
jan 1, 2013
255.121
+0.979
0.39%
jan 1, 2014
256.068
+0.946
0.37%
jan 1, 2015
256.999
+0.931
0.36%
jan 1, 2016
257.926
+0.927
0.36%
Ranking of countries by current statistics by years


Comments: