29
/
en
AIzaSyAYiBZKx7MnpbEhh9jyipgxe19OcubqV5w
April 1, 2024
107772
Colombia
COL
true
2
1
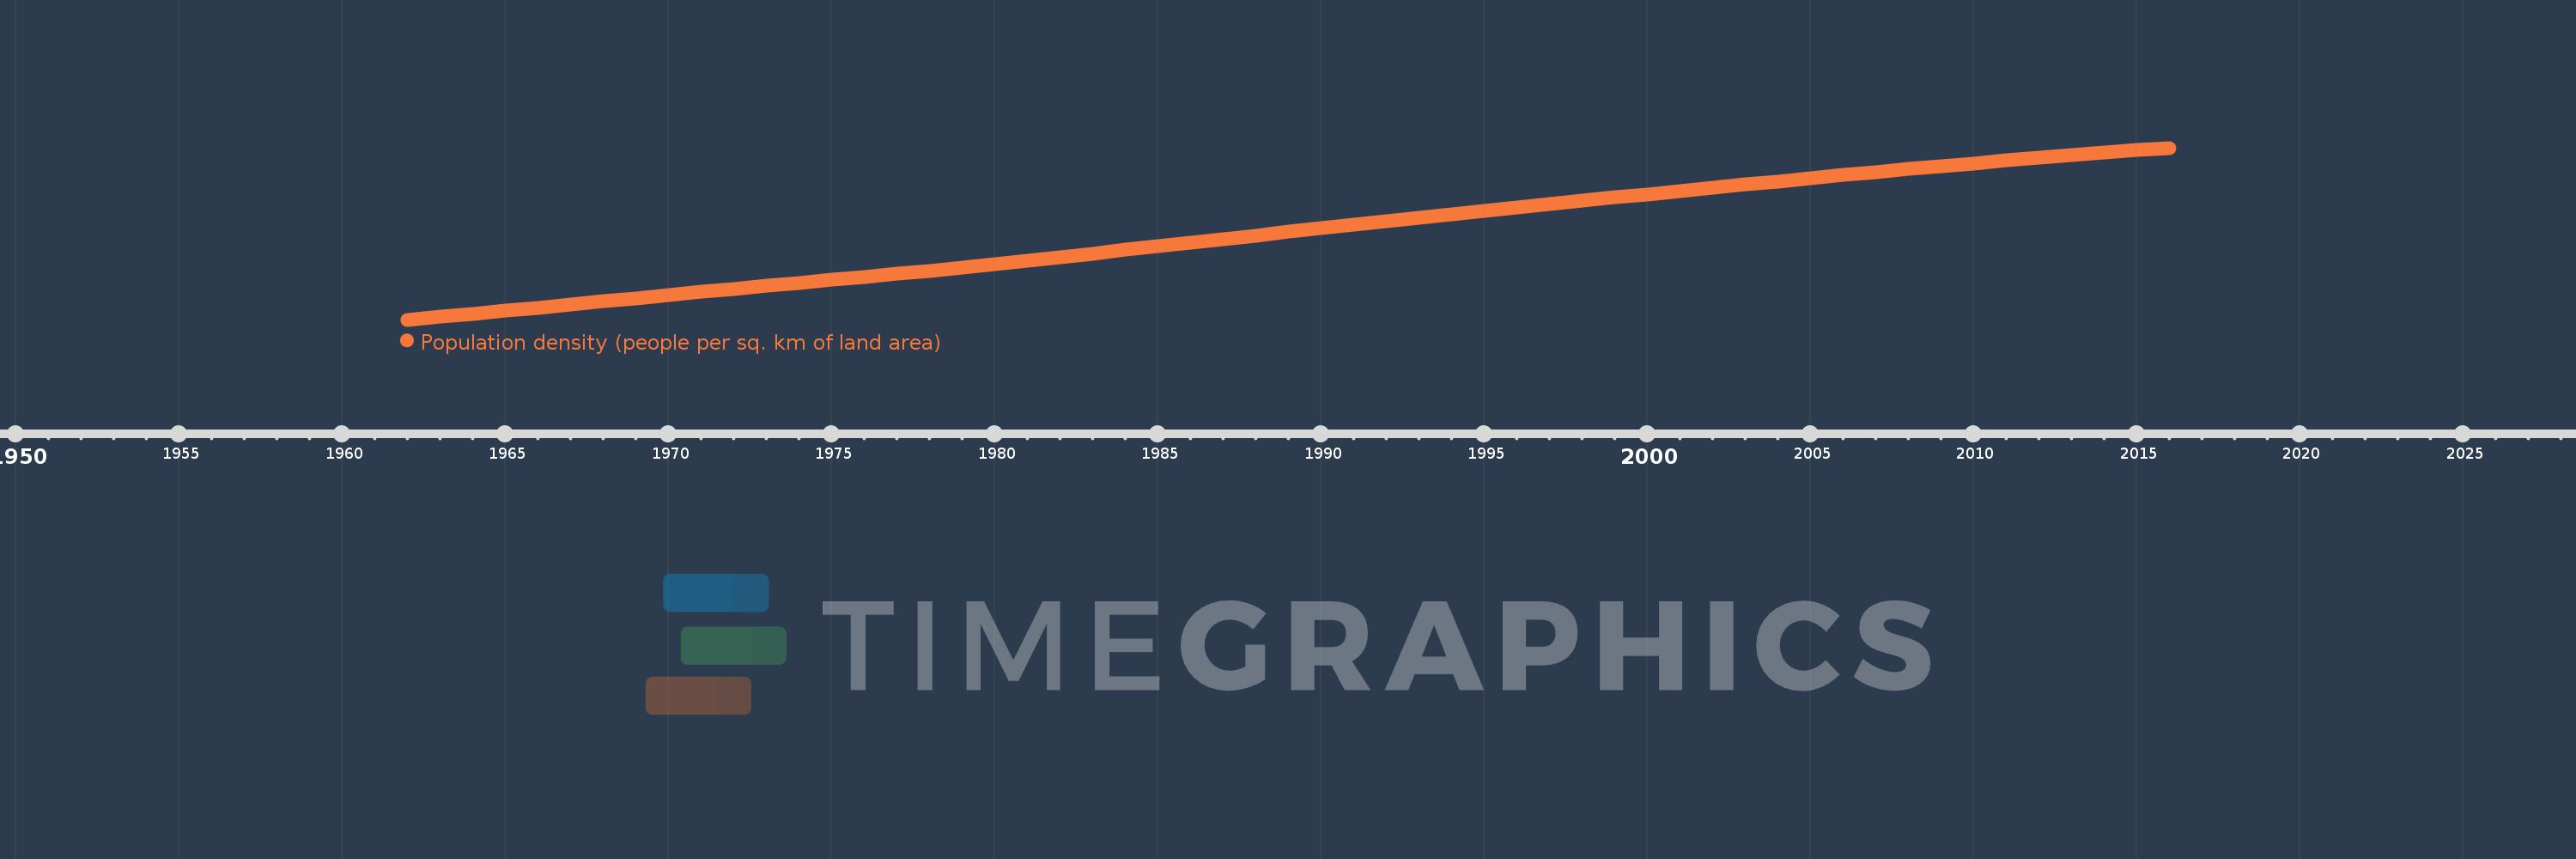
Population density (people per sq. km of land area)
2016,2015,2014,2013,2012,2011,2010,2009,2008,2007,2006,2005,2004,2003,2002,2001,2000,1999,1998,1997,1996,1995,1994,1993,1992,1991,1990,1989,1988,1987,1986,1985,1984,1983,1982,1981,1980,1979,1978,1977,1976,1975,1974,1973,1972,1971,1970,1969,1968,1967,1966,1965,1964,1963,1962
This statistics in other country:
AfghanistanAlbaniaAlgeriaAmerican SamoaAndorraAngolaAntigua and BarbudaArab WorldArgentinaArmeniaArubaAustraliaAustriaAzerbaijanBahamas, TheBahrainBangladeshBarbadosBelarusBelgiumBelizeBeninBermudaBhutanBoliviaBosnia and HerzegovinaBotswanaBrazilBritish Virgin IslandsBrunei DarussalamBulgariaBurkina FasoBurundiCabo VerdeCambodiaCameroonCanadaCaribbean small statesCayman IslandsCentral African RepublicCentral Europe and the BalticsChadChannel IslandsChileChinaColombiaComorosCongo, Dem. Rep.Congo, Rep.Costa RicaCote d'IvoireCroatiaCubaCuracaoCyprusCzech RepublicDenmarkDjiboutiDominicaDominican RepublicEarly-demographic dividendEast Asia & PacificEast Asia & Pacific (excluding high income)East Asia & Pacific (IDA & IBRD countries)EcuadorEgypt, Arab Rep.El SalvadorEquatorial GuineaEritreaEstoniaEthiopiaEuro areaEurope & Central AsiaEurope & Central Asia (excluding high income)Europe & Central Asia (IDA & IBRD countries)European UnionFaroe IslandsFijiFinlandFragile and conflict affected situationsFranceFrench PolynesiaGabonGambia, TheGeorgiaGermanyGhanaGibraltarGreeceGreenlandGrenadaGuamGuatemalaGuineaGuinea-BissauGuyanaHaitiHeavily indebted poor countries (HIPC)High incomeHondurasHong Kong SAR, ChinaHungaryIBRD onlyIcelandIDA & IBRD totalIDA blendIDA onlyIDA totalIndiaIndonesiaIran, Islamic Rep.IraqIrelandIsle of ManIsraelItalyJamaicaJapanJordanKazakhstanKenyaKiribatiKorea, Dem. People’s Rep.Korea, Rep.KosovoKuwaitKyrgyz RepublicLao PDRLate-demographic dividendLatin America & Caribbean Latin America & Caribbean (excluding high income)Latin America & the Caribbean (IDA & IBRD countries)LatviaLeast developed countries: UN classificationLebanonLesothoLiberiaLibyaLiechtensteinLithuaniaLow & middle incomeLow incomeLower middle incomeLuxembourgMacao SAR, ChinaMacedonia, FYRMadagascarMalawiMalaysiaMaldivesMaliMaltaMarshall IslandsMauritaniaMauritiusMexicoMicronesia, Fed. Sts.Middle East & North AfricaMiddle East & North Africa (excluding high income)Middle East & North Africa (IDA & IBRD countries)Middle incomeMoldovaMonacoMongoliaMontenegroMoroccoMozambiqueMyanmarNamibiaNauruNepalNetherlandsNew CaledoniaNew ZealandNicaraguaNigerNigeriaNorth AmericaNorthern Mariana IslandsNorwayOECD membersOmanOther small statesPacific island small statesPakistanPalauPanamaPapua New GuineaParaguayPeruPhilippinesPolandPortugalPost-demographic dividendPre-demographic dividendPuerto RicoQatarRomaniaRussian FederationRwandaSamoaSan MarinoSao Tome and PrincipeSaudi ArabiaSenegalSerbiaSeychellesSierra LeoneSingaporeSint Maarten (Dutch part)Slovak RepublicSloveniaSmall statesSolomon IslandsSomaliaSouth AfricaSouth AsiaSouth Asia (IDA & IBRD)SpainSri LankaSt. Kitts and NevisSt. LuciaSt. Martin (French part)St. Vincent and the GrenadinesSub-Saharan Africa Sub-Saharan Africa (excluding high income)Sub-Saharan Africa (IDA & IBRD countries)SudanSurinameSwazilandSwedenSwitzerlandSyrian Arab RepublicTajikistanTanzaniaThailandTimor-LesteTogoTongaTrinidad and TobagoTunisiaTurkeyTurkmenistanTurks and Caicos IslandsTuvaluUgandaUkraineUnited Arab EmiratesUnited KingdomUnited StatesUpper middle incomeUruguayUzbekistanVanuatuVenezuela, RBVietnamVirgin Islands (U.S.)West Bank and GazaWorldYemen, Rep.ZambiaZimbabwe Timeline:
This timeline shows a graph from 1962 to 2016 of Colombia. No data until 1961. Number of actual observations by date: 55.
Source name:
World Development Indicators
Source organization:
Food and Agriculture Organization and World Bank population estimates.
Categories, topics:
Urban Development
Last updated:
apr 23, 2017
Indicators value changes by year
Minimum:
15.306
jan 1, 1962
Maximum:
43.469
jan 1, 2016
At the date of observation
Value
Absolute change
Change from previous value
jan 1, 1962
15.306
+15.306
0.0%
jan 1, 1963
15.773
+0.467
3.05%
jan 1, 1964
16.254
+0.481
3.05%
jan 1, 1965
16.748
+0.494
3.04%
jan 1, 1966
17.255
+0.507
3.03%
jan 1, 1967
17.775
+0.52
3.02%
jan 1, 1968
18.307
+0.532
2.99%
jan 1, 1969
18.842
+0.535
2.92%
jan 1, 1970
19.37
+0.528
2.8%
jan 1, 1971
19.884
+0.514
2.65%
jan 1, 1972
20.38
+0.496
2.5%
jan 1, 1973
20.862
+0.482
2.37%
jan 1, 1974
21.338
+0.476
2.28%
jan 1, 1975
21.819
+0.481
2.25%
jan 1, 1976
22.314
+0.495
2.27%
jan 1, 1977
22.824
+0.511
2.29%
jan 1, 1978
23.348
+0.524
2.3%
jan 1, 1979
23.887
+0.538
2.3%
jan 1, 1980
24.438
+0.551
2.31%
jan 1, 1981
25.0
+0.563
2.3%
jan 1, 1982
25.575
+0.575
2.3%
jan 1, 1983
26.162
+0.587
2.29%
jan 1, 1984
26.757
+0.595
2.27%
jan 1, 1985
27.355
+0.598
2.23%
jan 1, 1986
27.951
+0.596
2.18%
jan 1, 1987
28.544
+0.593
2.12%
jan 1, 1988
29.134
+0.59
2.07%
jan 1, 1989
29.721
+0.587
2.01%
jan 1, 1990
30.306
+0.585
1.97%
jan 1, 1991
30.889
+0.583
1.92%
jan 1, 1992
31.471
+0.582
1.88%
jan 1, 1993
32.049
+0.579
1.84%
jan 1, 1994
32.623
+0.574
1.79%
jan 1, 1995
33.189
+0.566
1.74%
jan 1, 1996
33.747
+0.557
1.68%
jan 1, 1997
34.294
+0.547
1.62%
jan 1, 1998
34.831
+0.538
1.57%
jan 1, 1999
35.362
+0.531
1.52%
jan 1, 2000
35.889
+0.527
1.49%
jan 1, 2001
36.416
+0.527
1.47%
jan 1, 2002
36.944
+0.527
1.45%
jan 1, 2003
37.47
+0.526
1.42%
jan 1, 2004
37.992
+0.522
1.39%
jan 1, 2005
38.508
+0.516
1.36%
jan 1, 2006
39.014
+0.506
1.31%
jan 1, 2007
39.509
+0.496
1.27%
jan 1, 2008
39.995
+0.486
1.23%
jan 1, 2009
40.47
+0.475
1.19%
jan 1, 2010
40.934
+0.464
1.15%
jan 1, 2011
41.386
+0.452
1.1%
jan 1, 2012
41.826
+0.44
1.06%
jan 1, 2013
42.254
+0.428
1.02%
jan 1, 2014
42.67
+0.416
0.98%
jan 1, 2015
43.075
+0.405
0.95%
jan 1, 2016
43.469
+0.394
0.92%
Ranking of countries by current statistics by years


Comments: