29
/
en
AIzaSyAYiBZKx7MnpbEhh9jyipgxe19OcubqV5w
April 1, 2024
28524
East Asia & Pacific (excluding high income)
EAP
false
2
1
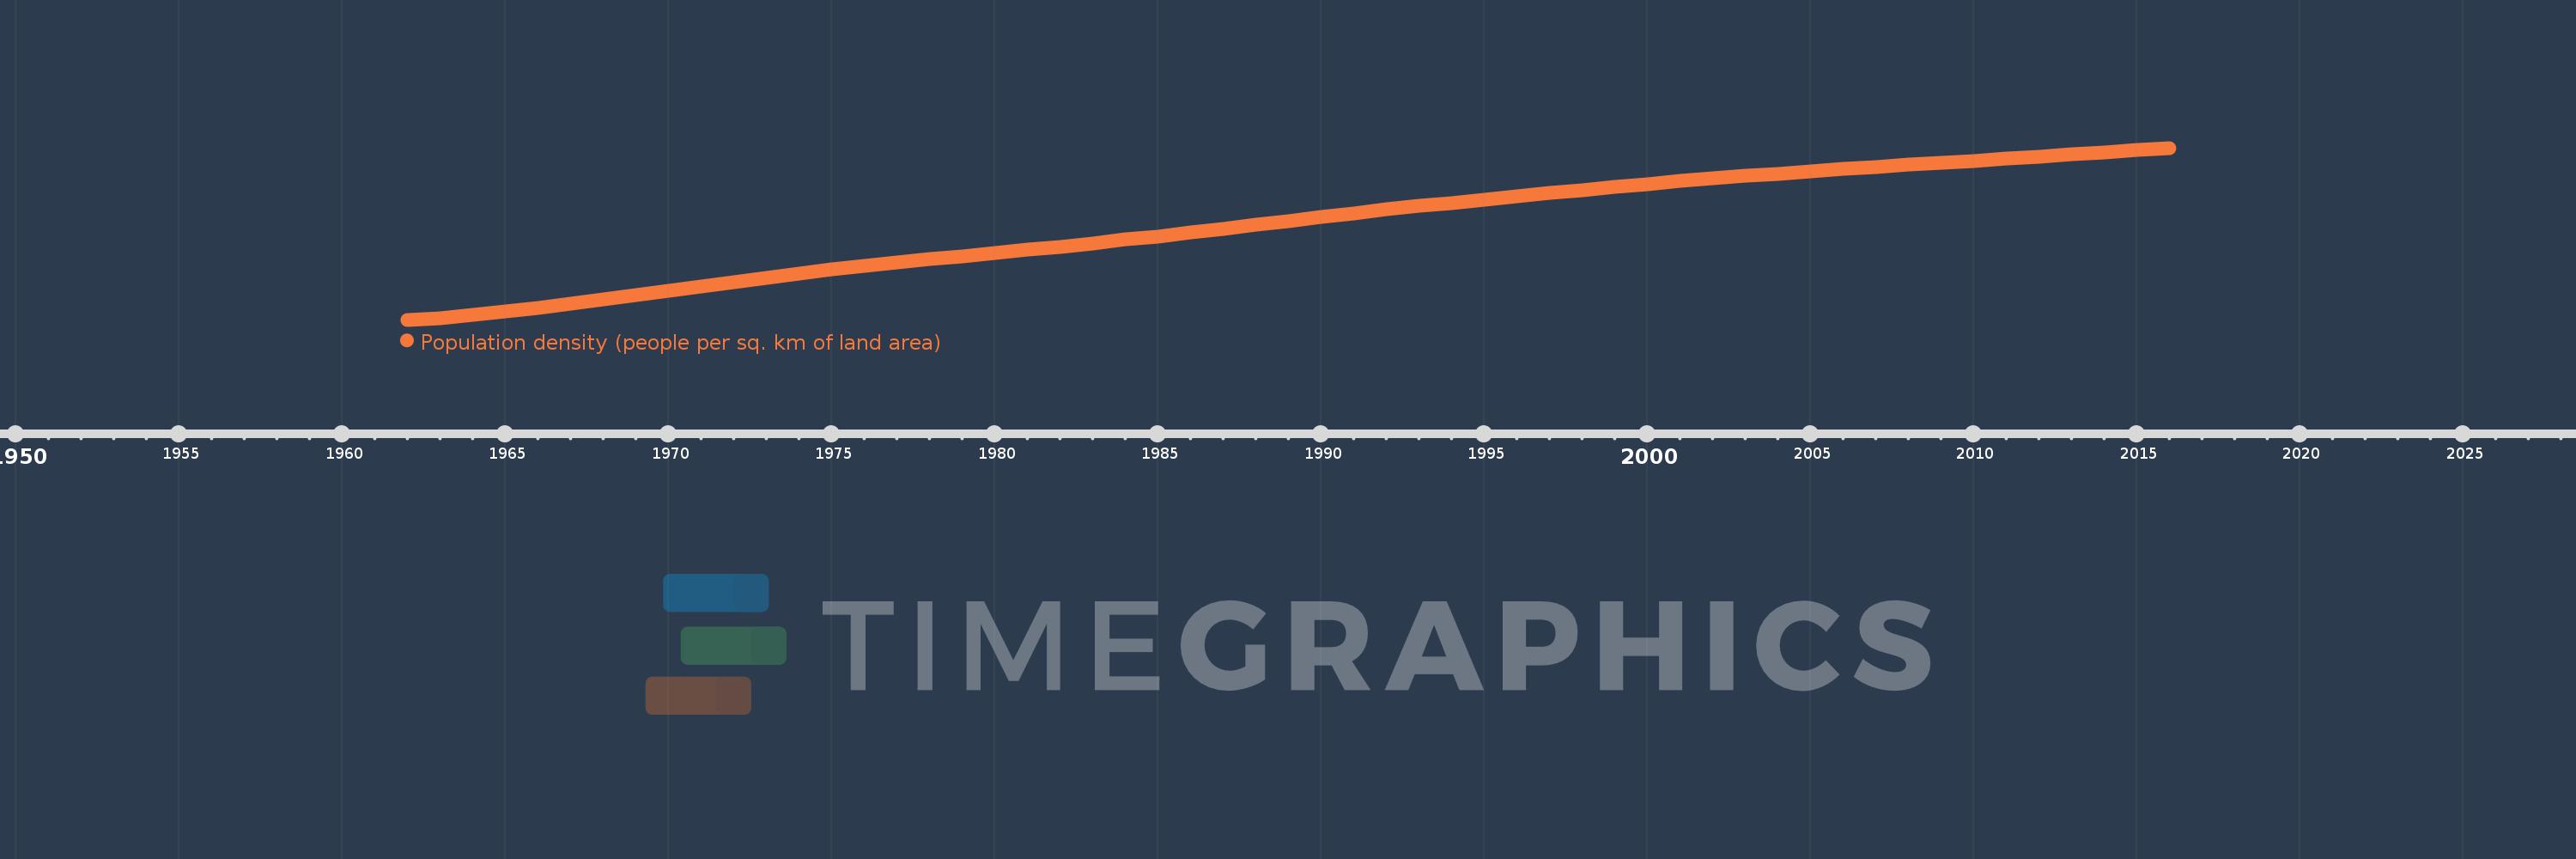
Population density (people per sq. km of land area)
2016,2015,2014,2013,2012,2011,2010,2009,2008,2007,2006,2005,2004,2003,2002,2001,2000,1999,1998,1997,1996,1995,1994,1993,1992,1991,1990,1989,1988,1987,1986,1985,1984,1983,1982,1981,1980,1979,1978,1977,1976,1975,1974,1973,1972,1971,1970,1969,1968,1967,1966,1965,1964,1963,1962
This statistics in other country:
AfghanistanAlbaniaAlgeriaAmerican SamoaAndorraAngolaAntigua and BarbudaArab WorldArgentinaArmeniaArubaAustraliaAustriaAzerbaijanBahamas, TheBahrainBangladeshBarbadosBelarusBelgiumBelizeBeninBermudaBhutanBoliviaBosnia and HerzegovinaBotswanaBrazilBritish Virgin IslandsBrunei DarussalamBulgariaBurkina FasoBurundiCabo VerdeCambodiaCameroonCanadaCaribbean small statesCayman IslandsCentral African RepublicCentral Europe and the BalticsChadChannel IslandsChileChinaColombiaComorosCongo, Dem. Rep.Congo, Rep.Costa RicaCote d'IvoireCroatiaCubaCuracaoCyprusCzech RepublicDenmarkDjiboutiDominicaDominican RepublicEarly-demographic dividendEast Asia & PacificEast Asia & Pacific (excluding high income)East Asia & Pacific (IDA & IBRD countries)EcuadorEgypt, Arab Rep.El SalvadorEquatorial GuineaEritreaEstoniaEthiopiaEuro areaEurope & Central AsiaEurope & Central Asia (excluding high income)Europe & Central Asia (IDA & IBRD countries)European UnionFaroe IslandsFijiFinlandFragile and conflict affected situationsFranceFrench PolynesiaGabonGambia, TheGeorgiaGermanyGhanaGibraltarGreeceGreenlandGrenadaGuamGuatemalaGuineaGuinea-BissauGuyanaHaitiHeavily indebted poor countries (HIPC)High incomeHondurasHong Kong SAR, ChinaHungaryIBRD onlyIcelandIDA & IBRD totalIDA blendIDA onlyIDA totalIndiaIndonesiaIran, Islamic Rep.IraqIrelandIsle of ManIsraelItalyJamaicaJapanJordanKazakhstanKenyaKiribatiKorea, Dem. People’s Rep.Korea, Rep.KosovoKuwaitKyrgyz RepublicLao PDRLate-demographic dividendLatin America & Caribbean Latin America & Caribbean (excluding high income)Latin America & the Caribbean (IDA & IBRD countries)LatviaLeast developed countries: UN classificationLebanonLesothoLiberiaLibyaLiechtensteinLithuaniaLow & middle incomeLow incomeLower middle incomeLuxembourgMacao SAR, ChinaMacedonia, FYRMadagascarMalawiMalaysiaMaldivesMaliMaltaMarshall IslandsMauritaniaMauritiusMexicoMicronesia, Fed. Sts.Middle East & North AfricaMiddle East & North Africa (excluding high income)Middle East & North Africa (IDA & IBRD countries)Middle incomeMoldovaMonacoMongoliaMontenegroMoroccoMozambiqueMyanmarNamibiaNauruNepalNetherlandsNew CaledoniaNew ZealandNicaraguaNigerNigeriaNorth AmericaNorthern Mariana IslandsNorwayOECD membersOmanOther small statesPacific island small statesPakistanPalauPanamaPapua New GuineaParaguayPeruPhilippinesPolandPortugalPost-demographic dividendPre-demographic dividendPuerto RicoQatarRomaniaRussian FederationRwandaSamoaSan MarinoSao Tome and PrincipeSaudi ArabiaSenegalSerbiaSeychellesSierra LeoneSingaporeSint Maarten (Dutch part)Slovak RepublicSloveniaSmall statesSolomon IslandsSomaliaSouth AfricaSouth AsiaSouth Asia (IDA & IBRD)SpainSri LankaSt. Kitts and NevisSt. LuciaSt. Martin (French part)St. Vincent and the GrenadinesSub-Saharan Africa Sub-Saharan Africa (excluding high income)Sub-Saharan Africa (IDA & IBRD countries)SudanSurinameSwazilandSwedenSwitzerlandSyrian Arab RepublicTajikistanTanzaniaThailandTimor-LesteTogoTongaTrinidad and TobagoTunisiaTurkeyTurkmenistanTurks and Caicos IslandsTuvaluUgandaUkraineUnited Arab EmiratesUnited KingdomUnited StatesUpper middle incomeUruguayUzbekistanVanuatuVenezuela, RBVietnamVirgin Islands (U.S.)West Bank and GazaWorldYemen, Rep.ZambiaZimbabwe Timeline:
This timeline shows a graph from 1962 to 2016 of East Asia & Pacific (excluding high income). No data until 1961. Number of actual observations by date: 55.
Source name:
World Development Indicators
Source organization:
Food and Agriculture Organization and World Bank population estimates.
Categories, topics:
Urban Development
Last updated:
apr 23, 2017
Indicators value changes by year
Minimum:
56.237
jan 1, 1962
Maximum:
127.88
jan 1, 2016
At the date of observation
Value
Absolute change
Change from previous value
jan 1, 1962
56.237
+56.237
0.0%
jan 1, 1963
56.966
+0.729
1.3%
jan 1, 1964
58.404
+1.437
2.52%
jan 1, 1965
59.819
+1.415
2.42%
jan 1, 1966
61.299
+1.48
2.47%
jan 1, 1967
63.005
+1.706
2.78%
jan 1, 1968
64.656
+1.651
2.62%
jan 1, 1969
66.37
+1.714
2.65%
jan 1, 1970
68.194
+1.824
2.75%
jan 1, 1971
70.078
+1.884
2.76%
jan 1, 1972
72.007
+1.928
2.75%
jan 1, 1973
73.829
+1.822
2.53%
jan 1, 1974
75.594
+1.765
2.39%
jan 1, 1975
77.264
+1.67
2.21%
jan 1, 1976
78.781
+1.517
1.96%
jan 1, 1977
80.179
+1.398
1.78%
jan 1, 1978
81.476
+1.297
1.62%
jan 1, 1979
82.769
+1.293
1.59%
jan 1, 1980
84.08
+1.311
1.58%
jan 1, 1981
85.368
+1.288
1.53%
jan 1, 1982
86.694
+1.326
1.55%
jan 1, 1983
88.164
+1.47
1.7%
jan 1, 1984
89.641
+1.477
1.67%
jan 1, 1985
91.052
+1.412
1.57%
jan 1, 1986
92.515
+1.463
1.61%
jan 1, 1987
94.085
+1.57
1.7%
jan 1, 1988
95.754
+1.669
1.77%
jan 1, 1989
97.442
+1.688
1.76%
jan 1, 1990
99.088
+1.645
1.69%
jan 1, 1991
100.678
+1.59
1.61%
jan 1, 1992
102.191
+1.512
1.5%
jan 1, 1993
103.613
+1.423
1.39%
jan 1, 1994
104.984
+1.37
1.32%
jan 1, 1995
106.346
+1.363
1.3%
jan 1, 1996
107.686
+1.339
1.26%
jan 1, 1997
109.005
+1.319
1.23%
jan 1, 1998
110.313
+1.308
1.2%
jan 1, 1999
111.579
+1.266
1.15%
jan 1, 2000
112.776
+1.197
1.07%
jan 1, 2001
114.012
+1.235
1.1%
jan 1, 2002
115.096
+1.084
0.95%
jan 1, 2003
116.137
+1.041
0.9%
jan 1, 2004
117.138
+1.001
0.86%
jan 1, 2005
118.108
+0.97
0.83%
jan 1, 2006
119.06
+0.953
0.81%
jan 1, 2007
119.971
+0.911
0.77%
jan 1, 2008
120.841
+0.869
0.72%
jan 1, 2009
121.699
+0.858
0.71%
jan 1, 2010
122.55
+0.851
0.7%
jan 1, 2011
123.402
+0.852
0.7%
jan 1, 2012
124.268
+0.866
0.7%
jan 1, 2013
125.156
+0.888
0.71%
jan 1, 2014
126.058
+0.901
0.72%
jan 1, 2015
126.971
+0.913
0.72%
jan 1, 2016
127.88
+0.91
0.72%
Ranking of countries by current statistics by years


Comments: