29
/
en
AIzaSyAYiBZKx7MnpbEhh9jyipgxe19OcubqV5w
April 1, 2024
52164
North America
NAC
false
2
1
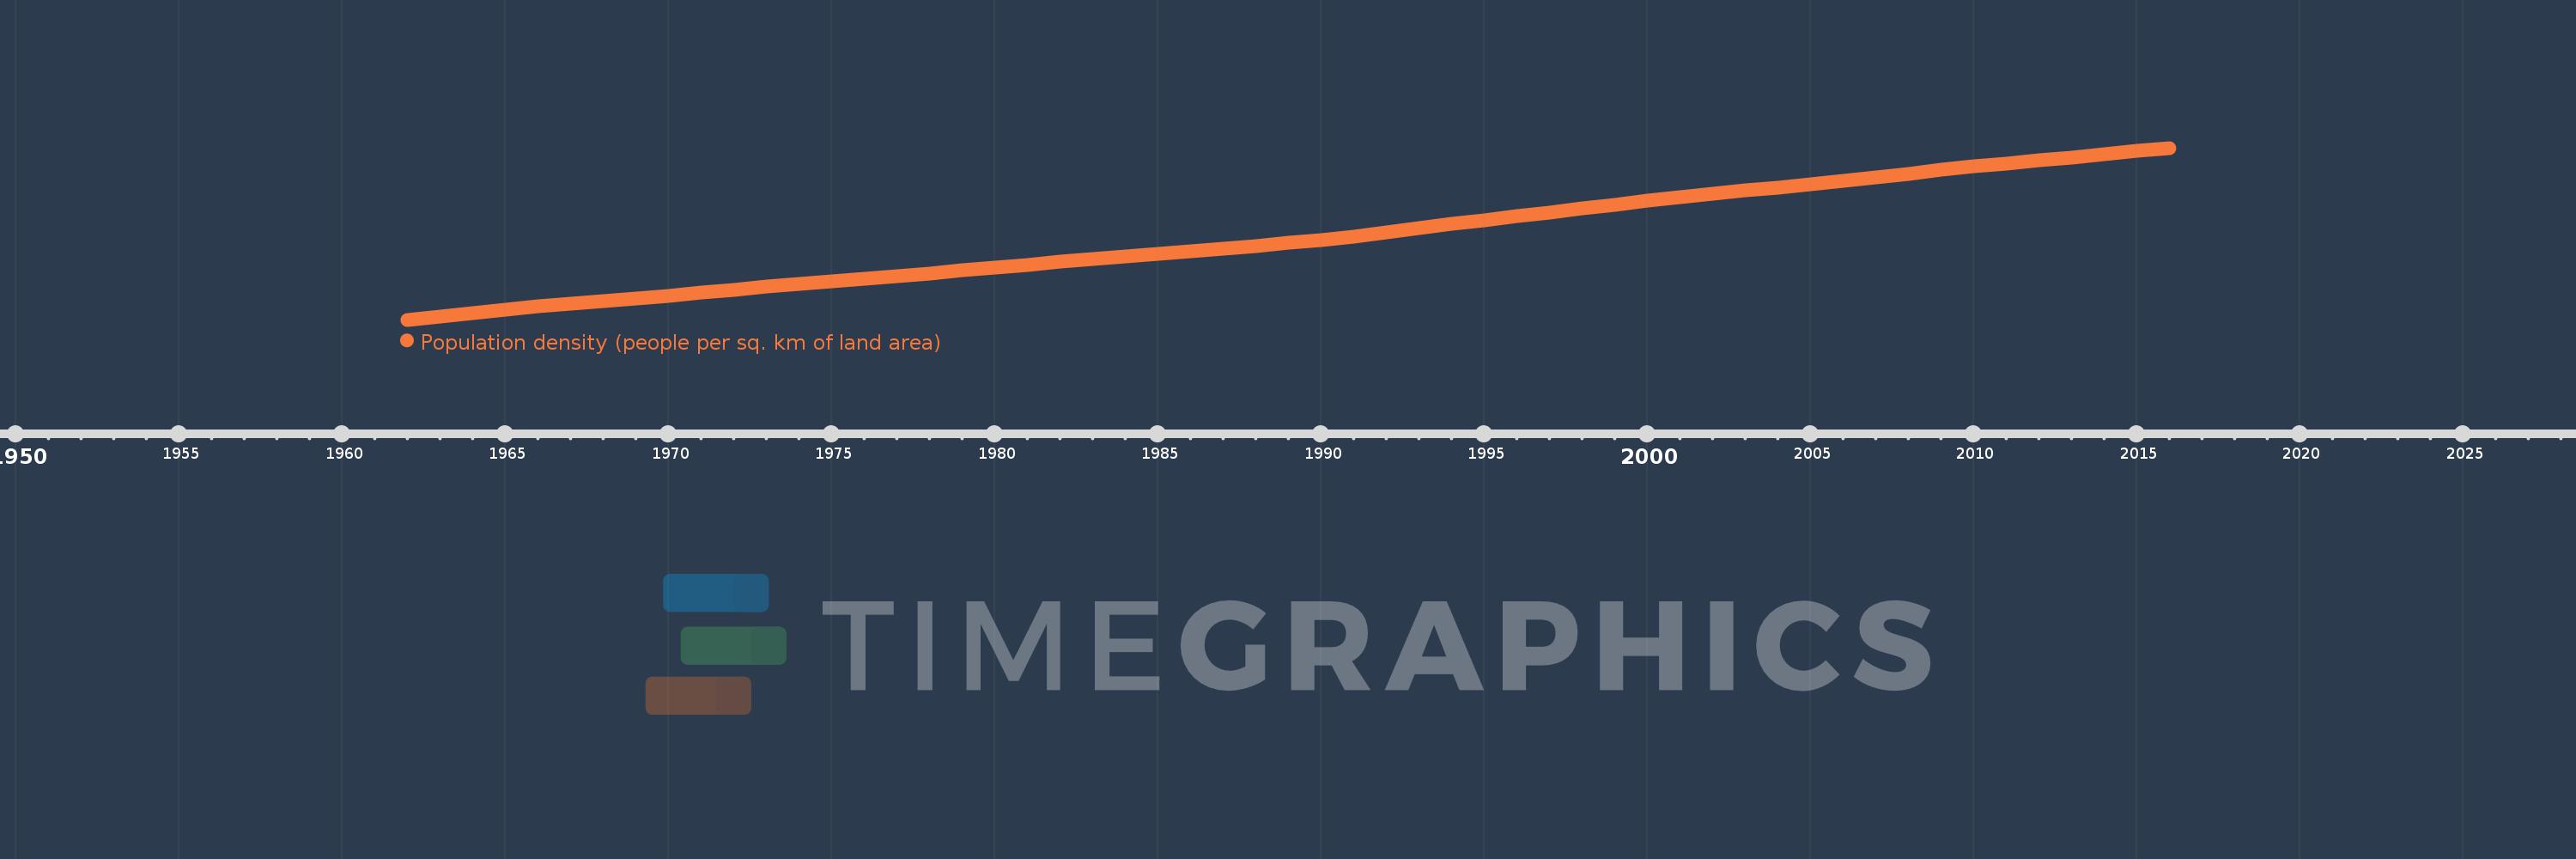
Population density (people per sq. km of land area)
2016,2015,2014,2013,2012,2011,2010,2009,2008,2007,2006,2005,2004,2003,2002,2001,2000,1999,1998,1997,1996,1995,1994,1993,1992,1991,1990,1989,1988,1987,1986,1985,1984,1983,1982,1981,1980,1979,1978,1977,1976,1975,1974,1973,1972,1971,1970,1969,1968,1967,1966,1965,1964,1963,1962
This statistics in other country:
AfghanistanAlbaniaAlgeriaAmerican SamoaAndorraAngolaAntigua and BarbudaArab WorldArgentinaArmeniaArubaAustraliaAustriaAzerbaijanBahamas, TheBahrainBangladeshBarbadosBelarusBelgiumBelizeBeninBermudaBhutanBoliviaBosnia and HerzegovinaBotswanaBrazilBritish Virgin IslandsBrunei DarussalamBulgariaBurkina FasoBurundiCabo VerdeCambodiaCameroonCanadaCaribbean small statesCayman IslandsCentral African RepublicCentral Europe and the BalticsChadChannel IslandsChileChinaColombiaComorosCongo, Dem. Rep.Congo, Rep.Costa RicaCote d'IvoireCroatiaCubaCuracaoCyprusCzech RepublicDenmarkDjiboutiDominicaDominican RepublicEarly-demographic dividendEast Asia & PacificEast Asia & Pacific (excluding high income)East Asia & Pacific (IDA & IBRD countries)EcuadorEgypt, Arab Rep.El SalvadorEquatorial GuineaEritreaEstoniaEthiopiaEuro areaEurope & Central AsiaEurope & Central Asia (excluding high income)Europe & Central Asia (IDA & IBRD countries)European UnionFaroe IslandsFijiFinlandFragile and conflict affected situationsFranceFrench PolynesiaGabonGambia, TheGeorgiaGermanyGhanaGibraltarGreeceGreenlandGrenadaGuamGuatemalaGuineaGuinea-BissauGuyanaHaitiHeavily indebted poor countries (HIPC)High incomeHondurasHong Kong SAR, ChinaHungaryIBRD onlyIcelandIDA & IBRD totalIDA blendIDA onlyIDA totalIndiaIndonesiaIran, Islamic Rep.IraqIrelandIsle of ManIsraelItalyJamaicaJapanJordanKazakhstanKenyaKiribatiKorea, Dem. People’s Rep.Korea, Rep.KosovoKuwaitKyrgyz RepublicLao PDRLate-demographic dividendLatin America & Caribbean Latin America & Caribbean (excluding high income)Latin America & the Caribbean (IDA & IBRD countries)LatviaLeast developed countries: UN classificationLebanonLesothoLiberiaLibyaLiechtensteinLithuaniaLow & middle incomeLow incomeLower middle incomeLuxembourgMacao SAR, ChinaMacedonia, FYRMadagascarMalawiMalaysiaMaldivesMaliMaltaMarshall IslandsMauritaniaMauritiusMexicoMicronesia, Fed. Sts.Middle East & North AfricaMiddle East & North Africa (excluding high income)Middle East & North Africa (IDA & IBRD countries)Middle incomeMoldovaMonacoMongoliaMontenegroMoroccoMozambiqueMyanmarNamibiaNauruNepalNetherlandsNew CaledoniaNew ZealandNicaraguaNigerNigeriaNorth AmericaNorthern Mariana IslandsNorwayOECD membersOmanOther small statesPacific island small statesPakistanPalauPanamaPapua New GuineaParaguayPeruPhilippinesPolandPortugalPost-demographic dividendPre-demographic dividendPuerto RicoQatarRomaniaRussian FederationRwandaSamoaSan MarinoSao Tome and PrincipeSaudi ArabiaSenegalSerbiaSeychellesSierra LeoneSingaporeSint Maarten (Dutch part)Slovak RepublicSloveniaSmall statesSolomon IslandsSomaliaSouth AfricaSouth AsiaSouth Asia (IDA & IBRD)SpainSri LankaSt. Kitts and NevisSt. LuciaSt. Martin (French part)St. Vincent and the GrenadinesSub-Saharan Africa Sub-Saharan Africa (excluding high income)Sub-Saharan Africa (IDA & IBRD countries)SudanSurinameSwazilandSwedenSwitzerlandSyrian Arab RepublicTajikistanTanzaniaThailandTimor-LesteTogoTongaTrinidad and TobagoTunisiaTurkeyTurkmenistanTurks and Caicos IslandsTuvaluUgandaUkraineUnited Arab EmiratesUnited KingdomUnited StatesUpper middle incomeUruguayUzbekistanVanuatuVenezuela, RBVietnamVirgin Islands (U.S.)West Bank and GazaWorldYemen, Rep.ZambiaZimbabwe Timeline:
This timeline shows a graph from 1962 to 2016 of North America. No data until 1961. Number of actual observations by date: 55.
Source name:
World Development Indicators
Source organization:
Food and Agriculture Organization and World Bank population estimates.
Categories, topics:
Urban Development
Last updated:
apr 23, 2017
Indicators value changes by year
Minimum:
11.067
jan 1, 1962
At the date of observation
Value
Absolute change
Change from previous value
jan 1, 1962
11.067
+11.067
0.0%
jan 1, 1963
11.242
+0.175
1.58%
jan 1, 1964
11.41
+0.167
1.49%
jan 1, 1965
11.574
+0.165
1.44%
jan 1, 1966
11.726
+0.152
1.31%
jan 1, 1967
11.87
+0.144
1.23%
jan 1, 1968
12.008
+0.138
1.16%
jan 1, 1969
12.135
+0.127
1.06%
jan 1, 1970
12.259
+0.124
1.02%
jan 1, 1971
12.405
+0.146
1.19%
jan 1, 1972
12.566
+0.161
1.29%
jan 1, 1973
12.707
+0.141
1.13%
jan 1, 1974
12.838
+0.131
1.03%
jan 1, 1975
12.967
+0.129
1.0%
jan 1, 1976
13.107
+0.14
1.08%
jan 1, 1977
13.237
+0.13
0.99%
jan 1, 1978
13.373
+0.136
1.03%
jan 1, 1979
13.515
+0.142
1.06%
jan 1, 1980
13.663
+0.149
1.1%
jan 1, 1981
13.799
+0.136
1.0%
jan 1, 1982
13.939
+0.14
1.01%
jan 1, 1983
14.076
+0.137
0.98%
jan 1, 1984
14.206
+0.131
0.93%
jan 1, 1985
14.331
+0.125
0.88%
jan 1, 1986
14.46
+0.128
0.89%
jan 1, 1987
14.595
+0.135
0.94%
jan 1, 1988
14.732
+0.137
0.94%
jan 1, 1989
14.872
+0.14
0.95%
jan 1, 1990
15.026
+0.154
1.03%
jan 1, 1991
15.202
+0.176
1.17%
jan 1, 1992
15.407
+0.205
1.35%
jan 1, 1993
15.619
+0.213
1.38%
jan 1, 1994
15.823
+0.204
1.3%
jan 1, 1995
16.014
+0.191
1.21%
jan 1, 1996
16.2
+0.186
1.16%
jan 1, 1997
16.388
+0.188
1.16%
jan 1, 1998
16.584
+0.196
1.2%
jan 1, 1999
16.774
+0.189
1.14%
jan 1, 2000
16.962
+0.188
1.12%
jan 1, 2001
17.145
+0.183
1.08%
jan 1, 2002
17.316
+0.171
1.0%
jan 1, 2003
17.477
+0.161
0.93%
jan 1, 2004
17.63
+0.153
0.88%
jan 1, 2005
17.795
+0.165
0.94%
jan 1, 2006
17.961
+0.166
0.93%
jan 1, 2007
18.132
+0.171
0.95%
jan 1, 2008
18.306
+0.174
0.96%
jan 1, 2009
18.497
+0.191
1.04%
jan 1, 2010
18.665
+0.168
0.91%
jan 1, 2011
18.827
+0.162
0.87%
jan 1, 2012
18.975
+0.149
0.79%
jan 1, 2013
19.128
+0.153
0.81%
jan 1, 2014
19.278
+0.15
0.78%
jan 1, 2015
19.435
+0.157
0.82%
jan 1, 2016
19.59
+0.154
0.79%
Ranking of countries by current statistics by years


Comments: