29
/
en
AIzaSyAYiBZKx7MnpbEhh9jyipgxe19OcubqV5w
April 1, 2024
25241
Caribbean small states
CSS
false
2
1
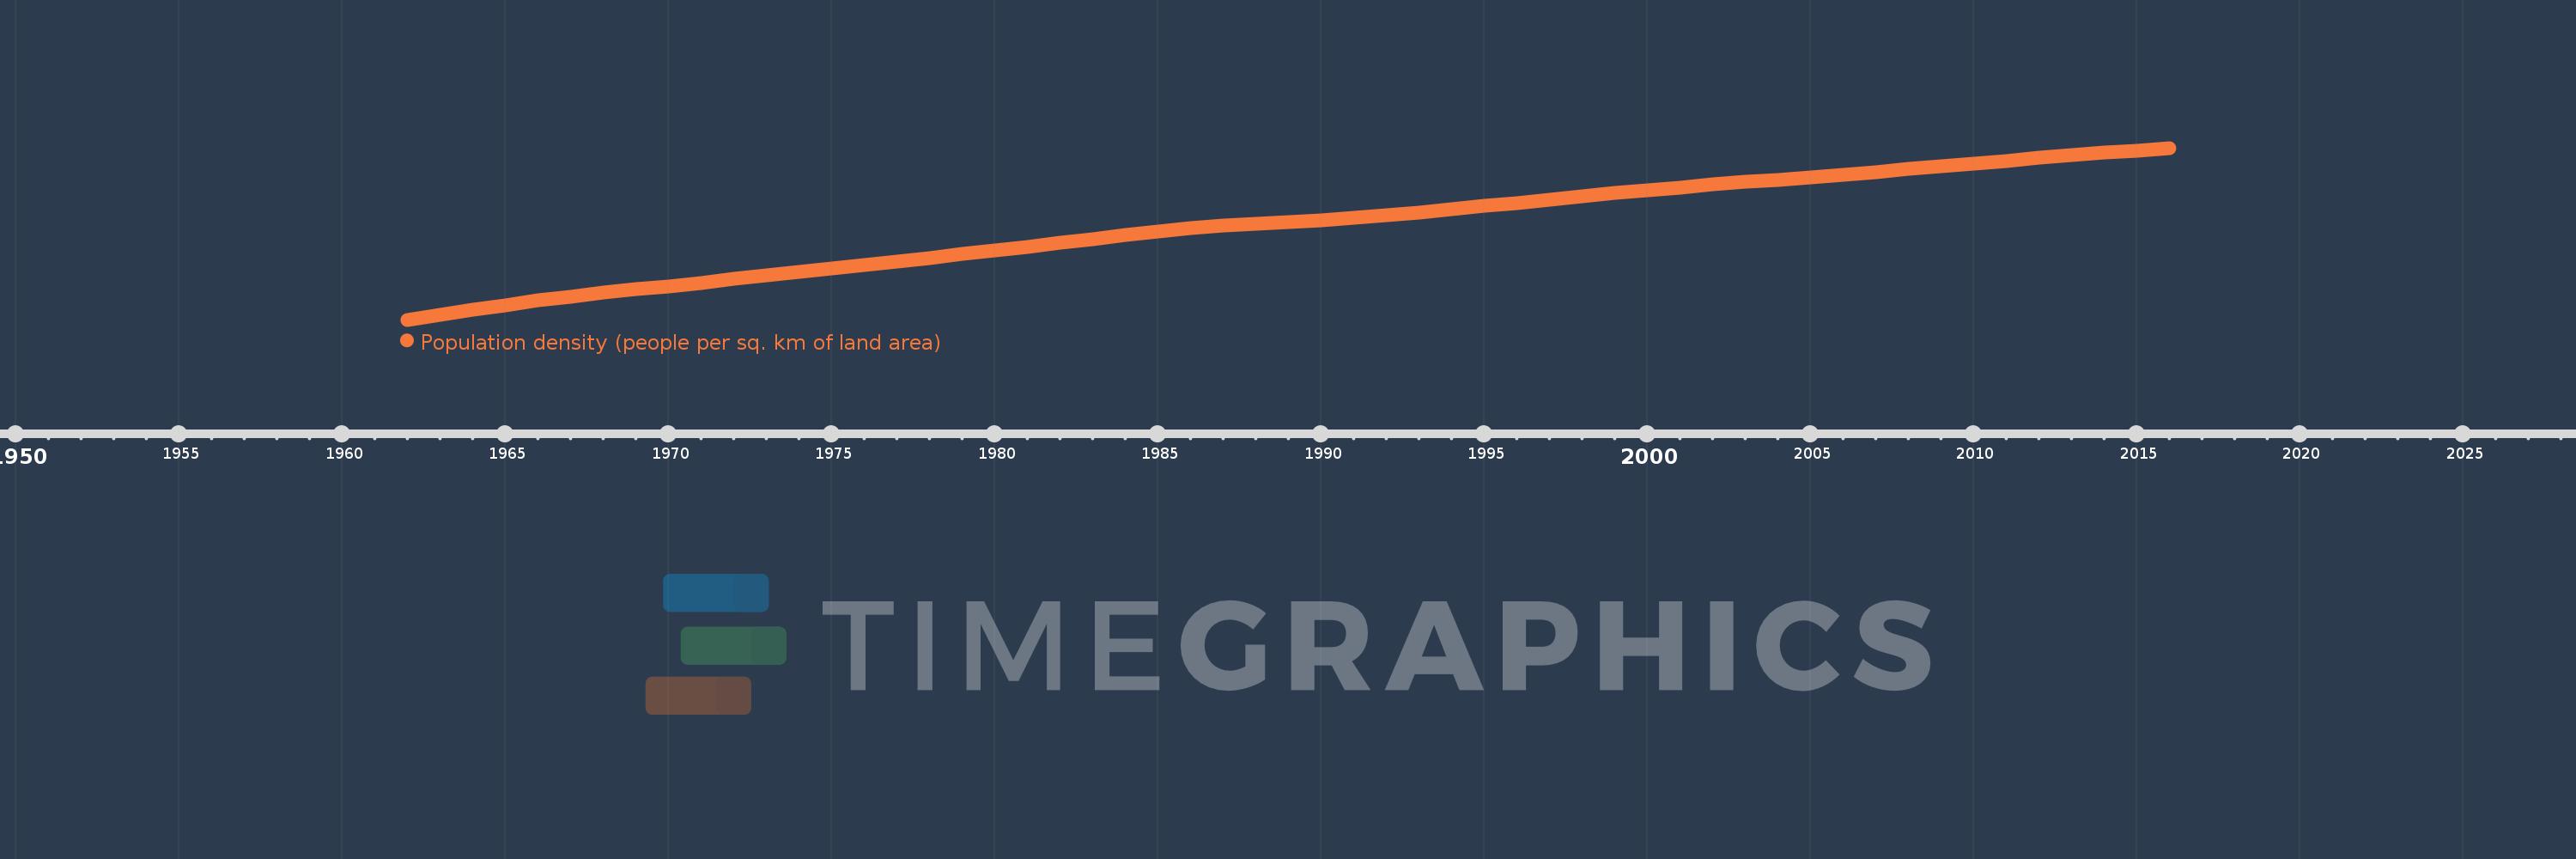
Population density (people per sq. km of land area)
2016,2015,2014,2013,2012,2011,2010,2009,2008,2007,2006,2005,2004,2003,2002,2001,2000,1999,1998,1997,1996,1995,1994,1993,1992,1991,1990,1989,1988,1987,1986,1985,1984,1983,1982,1981,1980,1979,1978,1977,1976,1975,1974,1973,1972,1971,1970,1969,1968,1967,1966,1965,1964,1963,1962
This statistics in other country:
AfghanistanAlbaniaAlgeriaAmerican SamoaAndorraAngolaAntigua and BarbudaArab WorldArgentinaArmeniaArubaAustraliaAustriaAzerbaijanBahamas, TheBahrainBangladeshBarbadosBelarusBelgiumBelizeBeninBermudaBhutanBoliviaBosnia and HerzegovinaBotswanaBrazilBritish Virgin IslandsBrunei DarussalamBulgariaBurkina FasoBurundiCabo VerdeCambodiaCameroonCanadaCaribbean small statesCayman IslandsCentral African RepublicCentral Europe and the BalticsChadChannel IslandsChileChinaColombiaComorosCongo, Dem. Rep.Congo, Rep.Costa RicaCote d'IvoireCroatiaCubaCuracaoCyprusCzech RepublicDenmarkDjiboutiDominicaDominican RepublicEarly-demographic dividendEast Asia & PacificEast Asia & Pacific (excluding high income)East Asia & Pacific (IDA & IBRD countries)EcuadorEgypt, Arab Rep.El SalvadorEquatorial GuineaEritreaEstoniaEthiopiaEuro areaEurope & Central AsiaEurope & Central Asia (excluding high income)Europe & Central Asia (IDA & IBRD countries)European UnionFaroe IslandsFijiFinlandFragile and conflict affected situationsFranceFrench PolynesiaGabonGambia, TheGeorgiaGermanyGhanaGibraltarGreeceGreenlandGrenadaGuamGuatemalaGuineaGuinea-BissauGuyanaHaitiHeavily indebted poor countries (HIPC)High incomeHondurasHong Kong SAR, ChinaHungaryIBRD onlyIcelandIDA & IBRD totalIDA blendIDA onlyIDA totalIndiaIndonesiaIran, Islamic Rep.IraqIrelandIsle of ManIsraelItalyJamaicaJapanJordanKazakhstanKenyaKiribatiKorea, Dem. People’s Rep.Korea, Rep.KosovoKuwaitKyrgyz RepublicLao PDRLate-demographic dividendLatin America & Caribbean Latin America & Caribbean (excluding high income)Latin America & the Caribbean (IDA & IBRD countries)LatviaLeast developed countries: UN classificationLebanonLesothoLiberiaLibyaLiechtensteinLithuaniaLow & middle incomeLow incomeLower middle incomeLuxembourgMacao SAR, ChinaMacedonia, FYRMadagascarMalawiMalaysiaMaldivesMaliMaltaMarshall IslandsMauritaniaMauritiusMexicoMicronesia, Fed. Sts.Middle East & North AfricaMiddle East & North Africa (excluding high income)Middle East & North Africa (IDA & IBRD countries)Middle incomeMoldovaMonacoMongoliaMontenegroMoroccoMozambiqueMyanmarNamibiaNauruNepalNetherlandsNew CaledoniaNew ZealandNicaraguaNigerNigeriaNorth AmericaNorthern Mariana IslandsNorwayOECD membersOmanOther small statesPacific island small statesPakistanPalauPanamaPapua New GuineaParaguayPeruPhilippinesPolandPortugalPost-demographic dividendPre-demographic dividendPuerto RicoQatarRomaniaRussian FederationRwandaSamoaSan MarinoSao Tome and PrincipeSaudi ArabiaSenegalSerbiaSeychellesSierra LeoneSingaporeSint Maarten (Dutch part)Slovak RepublicSloveniaSmall statesSolomon IslandsSomaliaSouth AfricaSouth AsiaSouth Asia (IDA & IBRD)SpainSri LankaSt. Kitts and NevisSt. LuciaSt. Martin (French part)St. Vincent and the GrenadinesSub-Saharan Africa Sub-Saharan Africa (excluding high income)Sub-Saharan Africa (IDA & IBRD countries)SudanSurinameSwazilandSwedenSwitzerlandSyrian Arab RepublicTajikistanTanzaniaThailandTimor-LesteTogoTongaTrinidad and TobagoTunisiaTurkeyTurkmenistanTurks and Caicos IslandsTuvaluUgandaUkraineUnited Arab EmiratesUnited KingdomUnited StatesUpper middle incomeUruguayUzbekistanVanuatuVenezuela, RBVietnamVirgin Islands (U.S.)West Bank and GazaWorldYemen, Rep.ZambiaZimbabwe Timeline:
This timeline shows a graph from 1962 to 2016 of Caribbean small states. No data until 1961. Number of actual observations by date: 55.
Source name:
World Development Indicators
Source organization:
Food and Agriculture Organization and World Bank population estimates.
Categories, topics:
Urban Development
Last updated:
apr 23, 2017
Indicators value changes by year
Minimum:
10.557
jan 1, 1962
Maximum:
17.578
jan 1, 2016
At the date of observation
Value
Absolute change
Change from previous value
jan 1, 1962
10.557
+10.557
0.0%
jan 1, 1963
10.761
+0.204
1.93%
jan 1, 1964
10.965
+0.203
1.89%
jan 1, 1965
11.159
+0.195
1.78%
jan 1, 1966
11.34
+0.18
1.62%
jan 1, 1967
11.504
+0.164
1.45%
jan 1, 1968
11.654
+0.15
1.3%
jan 1, 1969
11.795
+0.141
1.21%
jan 1, 1970
11.932
+0.138
1.17%
jan 1, 1971
12.072
+0.14
1.17%
jan 1, 1972
12.216
+0.144
1.19%
jan 1, 1973
12.363
+0.146
1.2%
jan 1, 1974
12.511
+0.148
1.2%
jan 1, 1975
12.659
+0.148
1.18%
jan 1, 1976
12.801
+0.143
1.13%
jan 1, 1977
12.946
+0.145
1.13%
jan 1, 1978
13.09
+0.144
1.11%
jan 1, 1979
13.234
+0.144
1.1%
jan 1, 1980
13.382
+0.148
1.12%
jan 1, 1981
13.537
+0.155
1.16%
jan 1, 1982
13.696
+0.159
1.18%
jan 1, 1983
13.86
+0.164
1.2%
jan 1, 1984
14.022
+0.161
1.16%
jan 1, 1985
14.169
+0.147
1.05%
jan 1, 1986
14.295
+0.126
0.89%
jan 1, 1987
14.397
+0.102
0.71%
jan 1, 1988
14.479
+0.081
0.57%
jan 1, 1989
14.549
+0.071
0.49%
jan 1, 1990
14.624
+0.074
0.51%
jan 1, 1991
14.712
+0.088
0.6%
jan 1, 1992
14.817
+0.105
0.72%
jan 1, 1993
14.936
+0.119
0.8%
jan 1, 1994
15.066
+0.129
0.87%
jan 1, 1995
15.199
+0.133
0.89%
jan 1, 1996
15.332
+0.133
0.87%
jan 1, 1997
15.464
+0.132
0.86%
jan 1, 1998
15.596
+0.132
0.85%
jan 1, 1999
15.726
+0.13
0.83%
jan 1, 2000
15.851
+0.125
0.8%
jan 1, 2001
15.97
+0.119
0.75%
jan 1, 2002
16.081
+0.111
0.69%
jan 1, 2003
16.184
+0.103
0.64%
jan 1, 2004
16.283
+0.099
0.61%
jan 1, 2005
16.384
+0.1
0.62%
jan 1, 2006
16.488
+0.104
0.64%
jan 1, 2007
16.598
+0.11
0.67%
jan 1, 2008
16.712
+0.114
0.69%
jan 1, 2009
16.828
+0.116
0.69%
jan 1, 2010
16.943
+0.115
0.69%
jan 1, 2011
17.056
+0.113
0.66%
jan 1, 2012
17.165
+0.109
0.64%
jan 1, 2013
17.271
+0.106
0.62%
jan 1, 2014
17.375
+0.104
0.6%
jan 1, 2015
17.477
+0.102
0.59%
jan 1, 2016
17.578
+0.101
0.58%
Ranking of countries by current statistics by years


Comments: