29
/
en
AIzaSyAYiBZKx7MnpbEhh9jyipgxe19OcubqV5w
April 1, 2024
58450
South Asia (IDA & IBRD)
TSA
false
2
1
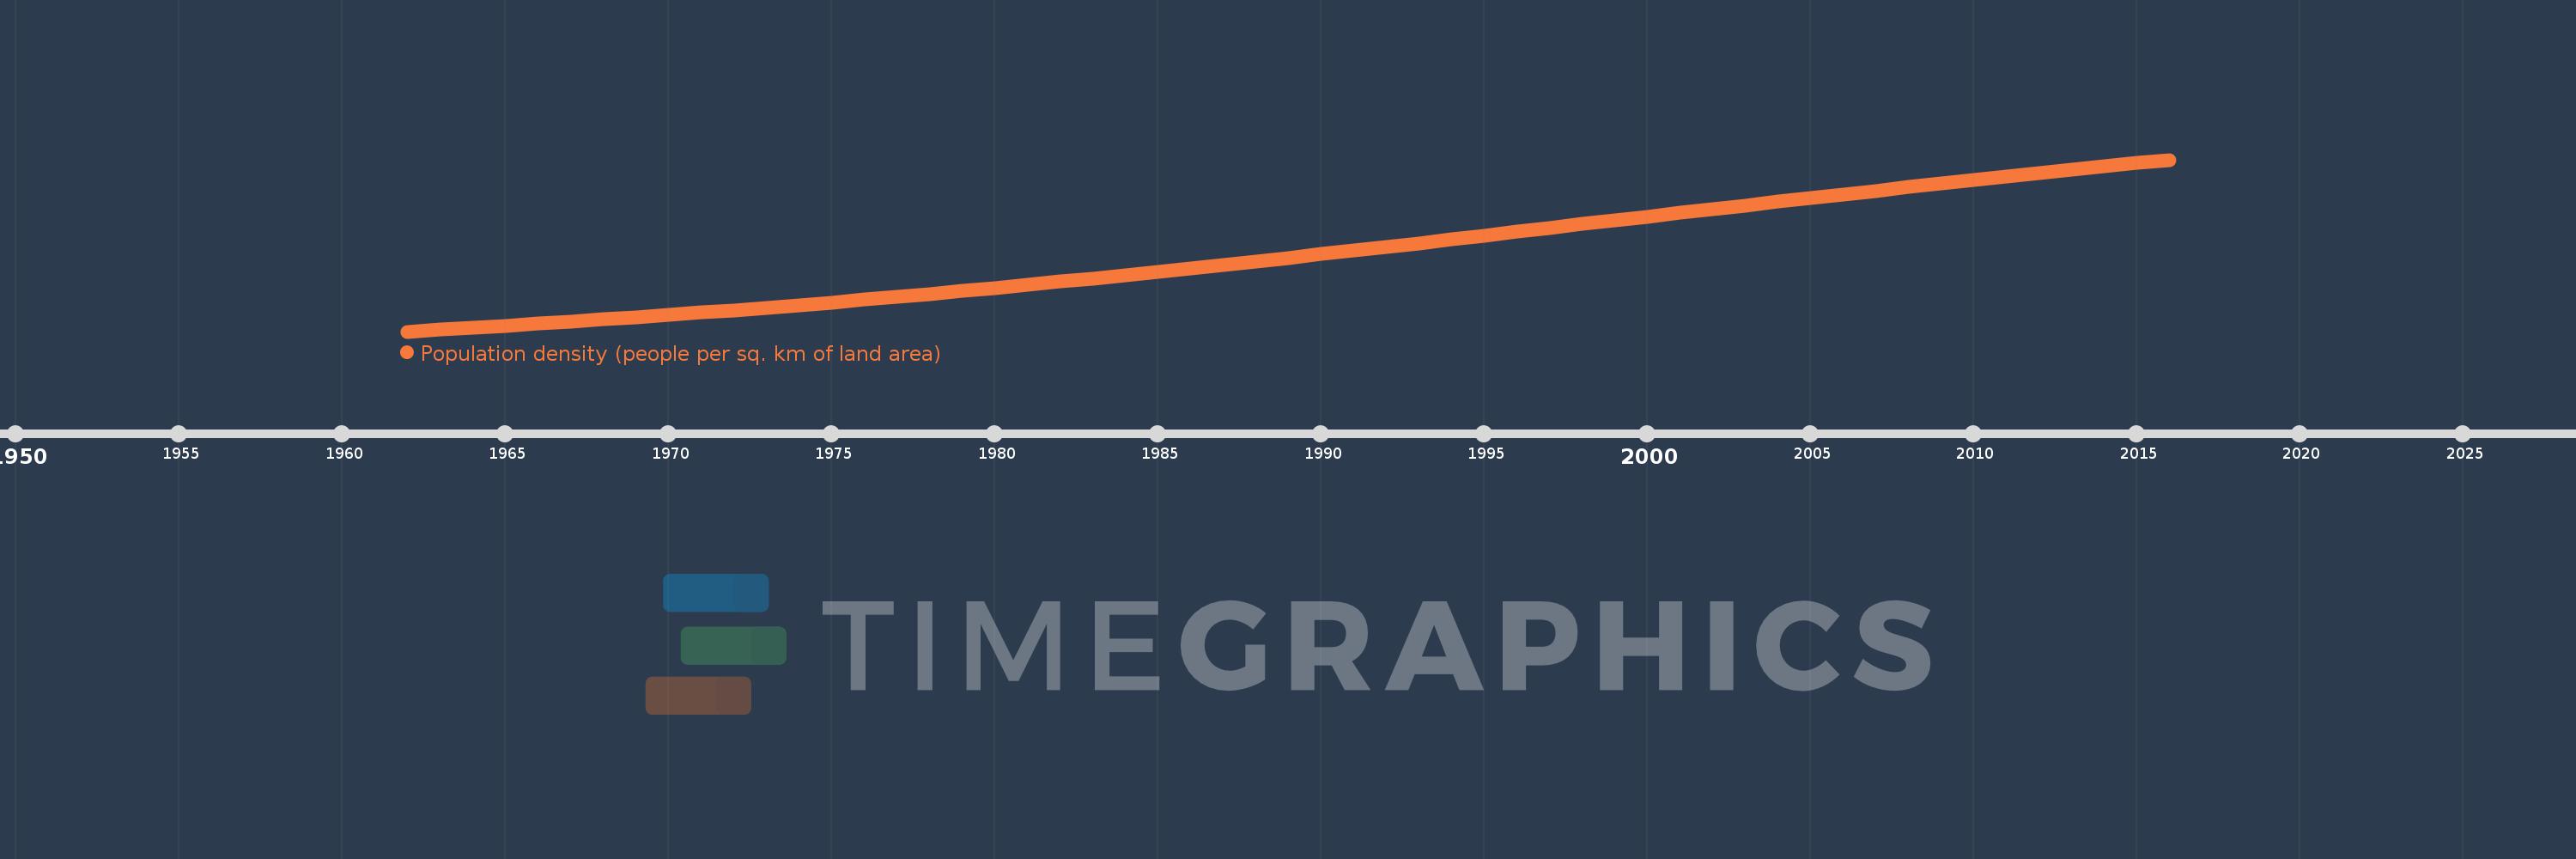
Population density (people per sq. km of land area)
2016,2015,2014,2013,2012,2011,2010,2009,2008,2007,2006,2005,2004,2003,2002,2001,2000,1999,1998,1997,1996,1995,1994,1993,1992,1991,1990,1989,1988,1987,1986,1985,1984,1983,1982,1981,1980,1979,1978,1977,1976,1975,1974,1973,1972,1971,1970,1969,1968,1967,1966,1965,1964,1963,1962
This statistics in other country:
AfghanistanAlbaniaAlgeriaAmerican SamoaAndorraAngolaAntigua and BarbudaArab WorldArgentinaArmeniaArubaAustraliaAustriaAzerbaijanBahamas, TheBahrainBangladeshBarbadosBelarusBelgiumBelizeBeninBermudaBhutanBoliviaBosnia and HerzegovinaBotswanaBrazilBritish Virgin IslandsBrunei DarussalamBulgariaBurkina FasoBurundiCabo VerdeCambodiaCameroonCanadaCaribbean small statesCayman IslandsCentral African RepublicCentral Europe and the BalticsChadChannel IslandsChileChinaColombiaComorosCongo, Dem. Rep.Congo, Rep.Costa RicaCote d'IvoireCroatiaCubaCuracaoCyprusCzech RepublicDenmarkDjiboutiDominicaDominican RepublicEarly-demographic dividendEast Asia & PacificEast Asia & Pacific (excluding high income)East Asia & Pacific (IDA & IBRD countries)EcuadorEgypt, Arab Rep.El SalvadorEquatorial GuineaEritreaEstoniaEthiopiaEuro areaEurope & Central AsiaEurope & Central Asia (excluding high income)Europe & Central Asia (IDA & IBRD countries)European UnionFaroe IslandsFijiFinlandFragile and conflict affected situationsFranceFrench PolynesiaGabonGambia, TheGeorgiaGermanyGhanaGibraltarGreeceGreenlandGrenadaGuamGuatemalaGuineaGuinea-BissauGuyanaHaitiHeavily indebted poor countries (HIPC)High incomeHondurasHong Kong SAR, ChinaHungaryIBRD onlyIcelandIDA & IBRD totalIDA blendIDA onlyIDA totalIndiaIndonesiaIran, Islamic Rep.IraqIrelandIsle of ManIsraelItalyJamaicaJapanJordanKazakhstanKenyaKiribatiKorea, Dem. People’s Rep.Korea, Rep.KosovoKuwaitKyrgyz RepublicLao PDRLate-demographic dividendLatin America & Caribbean Latin America & Caribbean (excluding high income)Latin America & the Caribbean (IDA & IBRD countries)LatviaLeast developed countries: UN classificationLebanonLesothoLiberiaLibyaLiechtensteinLithuaniaLow & middle incomeLow incomeLower middle incomeLuxembourgMacao SAR, ChinaMacedonia, FYRMadagascarMalawiMalaysiaMaldivesMaliMaltaMarshall IslandsMauritaniaMauritiusMexicoMicronesia, Fed. Sts.Middle East & North AfricaMiddle East & North Africa (excluding high income)Middle East & North Africa (IDA & IBRD countries)Middle incomeMoldovaMonacoMongoliaMontenegroMoroccoMozambiqueMyanmarNamibiaNauruNepalNetherlandsNew CaledoniaNew ZealandNicaraguaNigerNigeriaNorth AmericaNorthern Mariana IslandsNorwayOECD membersOmanOther small statesPacific island small statesPakistanPalauPanamaPapua New GuineaParaguayPeruPhilippinesPolandPortugalPost-demographic dividendPre-demographic dividendPuerto RicoQatarRomaniaRussian FederationRwandaSamoaSan MarinoSao Tome and PrincipeSaudi ArabiaSenegalSerbiaSeychellesSierra LeoneSingaporeSint Maarten (Dutch part)Slovak RepublicSloveniaSmall statesSolomon IslandsSomaliaSouth AfricaSouth AsiaSouth Asia (IDA & IBRD)SpainSri LankaSt. Kitts and NevisSt. LuciaSt. Martin (French part)St. Vincent and the GrenadinesSub-Saharan Africa Sub-Saharan Africa (excluding high income)Sub-Saharan Africa (IDA & IBRD countries)SudanSurinameSwazilandSwedenSwitzerlandSyrian Arab RepublicTajikistanTanzaniaThailandTimor-LesteTogoTongaTrinidad and TobagoTunisiaTurkeyTurkmenistanTurks and Caicos IslandsTuvaluUgandaUkraineUnited Arab EmiratesUnited KingdomUnited StatesUpper middle incomeUruguayUzbekistanVanuatuVenezuela, RBVietnamVirgin Islands (U.S.)West Bank and GazaWorldYemen, Rep.ZambiaZimbabwe Timeline:
This timeline shows a graph from 1962 to 2016 of South Asia (IDA & IBRD). No data until 1961. Number of actual observations by date: 55.
Source name:
World Development Indicators
Source organization:
Food and Agriculture Organization and World Bank population estimates.
Categories, topics:
Urban Development
Last updated:
apr 23, 2017
Indicators value changes by year
Minimum:
122.21
jan 1, 1962
Maximum:
365.531
jan 1, 2016
At the date of observation
Value
Absolute change
Change from previous value
jan 1, 1962
122.21
+122.21
0.0%
jan 1, 1963
124.837
+2.627
2.15%
jan 1, 1964
127.53
+2.693
2.16%
jan 1, 1965
130.355
+2.825
2.21%
jan 1, 1966
133.261
+2.906
2.23%
jan 1, 1967
136.265
+3.005
2.25%
jan 1, 1968
139.364
+3.098
2.27%
jan 1, 1969
142.559
+3.195
2.29%
jan 1, 1970
145.834
+3.275
2.3%
jan 1, 1971
149.193
+3.359
2.3%
jan 1, 1972
152.614
+3.421
2.29%
jan 1, 1973
156.119
+3.505
2.3%
jan 1, 1974
159.732
+3.613
2.31%
jan 1, 1975
163.448
+3.716
2.33%
jan 1, 1976
167.29
+3.842
2.35%
jan 1, 1977
171.259
+3.969
2.37%
jan 1, 1978
175.35
+4.09
2.39%
jan 1, 1979
179.56
+4.21
2.4%
jan 1, 1980
183.885
+4.325
2.41%
jan 1, 1981
188.309
+4.424
2.41%
jan 1, 1982
192.794
+4.485
2.38%
jan 1, 1983
197.405
+4.611
2.39%
jan 1, 1984
202.104
+4.699
2.38%
jan 1, 1985
206.886
+4.782
2.37%
jan 1, 1986
211.744
+4.858
2.35%
jan 1, 1987
216.673
+4.929
2.33%
jan 1, 1988
221.668
+4.995
2.31%
jan 1, 1989
226.725
+5.057
2.28%
jan 1, 1990
231.838
+5.114
2.26%
jan 1, 1991
237.003
+5.164
2.23%
jan 1, 1992
242.216
+5.213
2.2%
jan 1, 1993
247.469
+5.253
2.17%
jan 1, 1994
252.754
+5.285
2.14%
jan 1, 1995
258.434
+5.679
2.25%
jan 1, 1996
263.76
+5.327
2.06%
jan 1, 1997
269.09
+5.33
2.02%
jan 1, 1998
274.418
+5.328
1.98%
jan 1, 1999
279.744
+5.326
1.94%
jan 1, 2000
285.066
+5.322
1.9%
jan 1, 2001
290.359
+5.293
1.86%
jan 1, 2002
295.665
+5.306
1.83%
jan 1, 2003
300.953
+5.288
1.79%
jan 1, 2004
306.206
+5.253
1.75%
jan 1, 2005
311.512
+5.306
1.73%
jan 1, 2006
316.638
+5.126
1.65%
jan 1, 2007
321.686
+5.048
1.59%
jan 1, 2008
326.66
+4.974
1.55%
jan 1, 2009
331.577
+4.917
1.51%
jan 1, 2010
336.46
+4.883
1.47%
jan 1, 2011
341.332
+4.872
1.45%
jan 1, 2012
346.194
+4.862
1.42%
jan 1, 2013
351.041
+4.848
1.4%
jan 1, 2014
355.878
+4.837
1.38%
jan 1, 2015
360.709
+4.831
1.36%
jan 1, 2016
365.531
+4.822
1.34%
Ranking of countries by current statistics by years


Comments: