29
/
en
AIzaSyAYiBZKx7MnpbEhh9jyipgxe19OcubqV5w
April 1, 2024
49414
Middle East & North Africa (excluding high income)
MNA
false
2
1
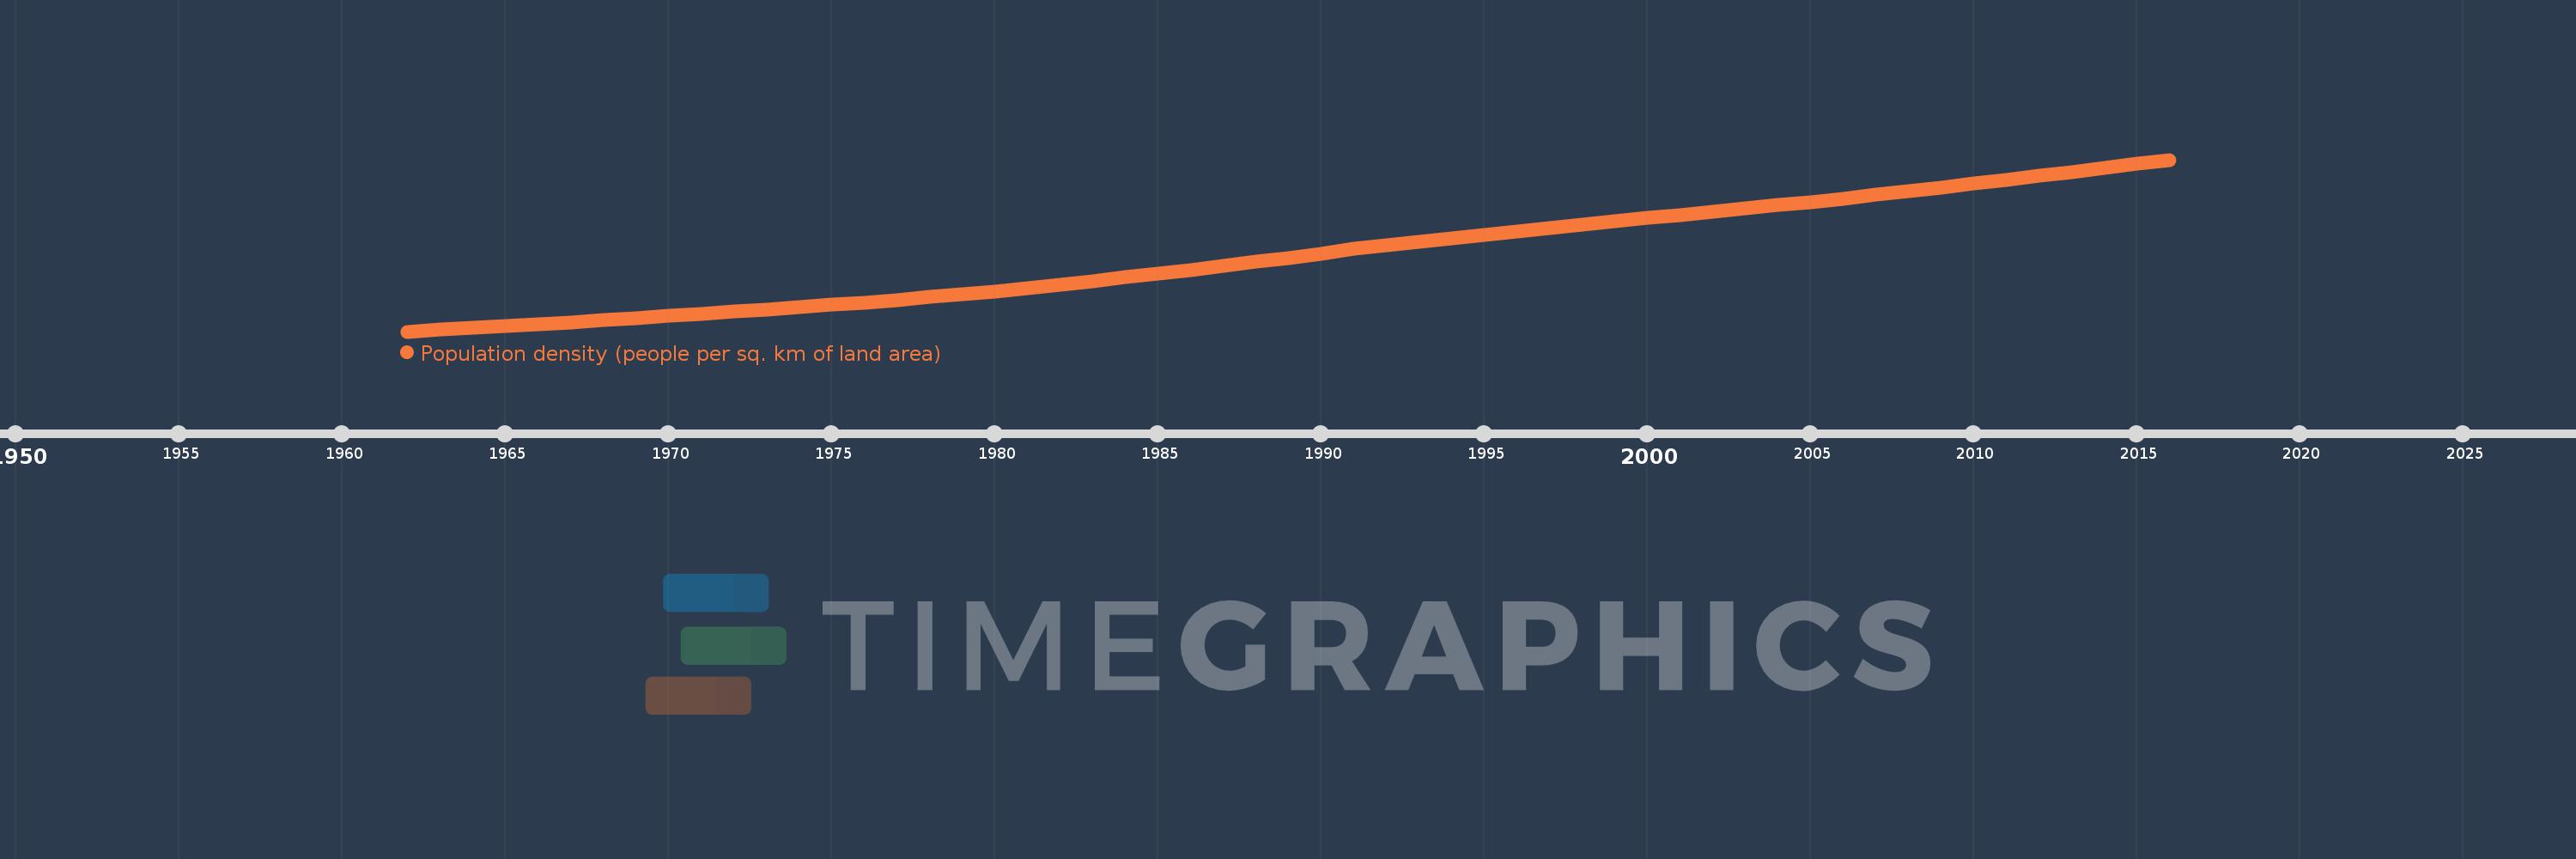
Population density (people per sq. km of land area)
2016,2015,2014,2013,2012,2011,2010,2009,2008,2007,2006,2005,2004,2003,2002,2001,2000,1999,1998,1997,1996,1995,1994,1993,1992,1991,1990,1989,1988,1987,1986,1985,1984,1983,1982,1981,1980,1979,1978,1977,1976,1975,1974,1973,1972,1971,1970,1969,1968,1967,1966,1965,1964,1963,1962
This statistics in other country:
AfghanistanAlbaniaAlgeriaAmerican SamoaAndorraAngolaAntigua and BarbudaArab WorldArgentinaArmeniaArubaAustraliaAustriaAzerbaijanBahamas, TheBahrainBangladeshBarbadosBelarusBelgiumBelizeBeninBermudaBhutanBoliviaBosnia and HerzegovinaBotswanaBrazilBritish Virgin IslandsBrunei DarussalamBulgariaBurkina FasoBurundiCabo VerdeCambodiaCameroonCanadaCaribbean small statesCayman IslandsCentral African RepublicCentral Europe and the BalticsChadChannel IslandsChileChinaColombiaComorosCongo, Dem. Rep.Congo, Rep.Costa RicaCote d'IvoireCroatiaCubaCuracaoCyprusCzech RepublicDenmarkDjiboutiDominicaDominican RepublicEarly-demographic dividendEast Asia & PacificEast Asia & Pacific (excluding high income)East Asia & Pacific (IDA & IBRD countries)EcuadorEgypt, Arab Rep.El SalvadorEquatorial GuineaEritreaEstoniaEthiopiaEuro areaEurope & Central AsiaEurope & Central Asia (excluding high income)Europe & Central Asia (IDA & IBRD countries)European UnionFaroe IslandsFijiFinlandFragile and conflict affected situationsFranceFrench PolynesiaGabonGambia, TheGeorgiaGermanyGhanaGibraltarGreeceGreenlandGrenadaGuamGuatemalaGuineaGuinea-BissauGuyanaHaitiHeavily indebted poor countries (HIPC)High incomeHondurasHong Kong SAR, ChinaHungaryIBRD onlyIcelandIDA & IBRD totalIDA blendIDA onlyIDA totalIndiaIndonesiaIran, Islamic Rep.IraqIrelandIsle of ManIsraelItalyJamaicaJapanJordanKazakhstanKenyaKiribatiKorea, Dem. People’s Rep.Korea, Rep.KosovoKuwaitKyrgyz RepublicLao PDRLate-demographic dividendLatin America & Caribbean Latin America & Caribbean (excluding high income)Latin America & the Caribbean (IDA & IBRD countries)LatviaLeast developed countries: UN classificationLebanonLesothoLiberiaLibyaLiechtensteinLithuaniaLow & middle incomeLow incomeLower middle incomeLuxembourgMacao SAR, ChinaMacedonia, FYRMadagascarMalawiMalaysiaMaldivesMaliMaltaMarshall IslandsMauritaniaMauritiusMexicoMicronesia, Fed. Sts.Middle East & North AfricaMiddle East & North Africa (excluding high income)Middle East & North Africa (IDA & IBRD countries)Middle incomeMoldovaMonacoMongoliaMontenegroMoroccoMozambiqueMyanmarNamibiaNauruNepalNetherlandsNew CaledoniaNew ZealandNicaraguaNigerNigeriaNorth AmericaNorthern Mariana IslandsNorwayOECD membersOmanOther small statesPacific island small statesPakistanPalauPanamaPapua New GuineaParaguayPeruPhilippinesPolandPortugalPost-demographic dividendPre-demographic dividendPuerto RicoQatarRomaniaRussian FederationRwandaSamoaSan MarinoSao Tome and PrincipeSaudi ArabiaSenegalSerbiaSeychellesSierra LeoneSingaporeSint Maarten (Dutch part)Slovak RepublicSloveniaSmall statesSolomon IslandsSomaliaSouth AfricaSouth AsiaSouth Asia (IDA & IBRD)SpainSri LankaSt. Kitts and NevisSt. LuciaSt. Martin (French part)St. Vincent and the GrenadinesSub-Saharan Africa Sub-Saharan Africa (excluding high income)Sub-Saharan Africa (IDA & IBRD countries)SudanSurinameSwazilandSwedenSwitzerlandSyrian Arab RepublicTajikistanTanzaniaThailandTimor-LesteTogoTongaTrinidad and TobagoTunisiaTurkeyTurkmenistanTurks and Caicos IslandsTuvaluUgandaUkraineUnited Arab EmiratesUnited KingdomUnited StatesUpper middle incomeUruguayUzbekistanVanuatuVenezuela, RBVietnamVirgin Islands (U.S.)West Bank and GazaWorldYemen, Rep.ZambiaZimbabwe Timeline:
This timeline shows a graph from 1962 to 2016 of Middle East & North Africa (excluding high income). No data until 1961. Number of actual observations by date: 55.
Source name:
World Development Indicators
Source organization:
Food and Agriculture Organization and World Bank population estimates.
Categories, topics:
Urban Development
Last updated:
apr 23, 2017
Indicators value changes by year
Minimum:
11.624
jan 1, 1962
Maximum:
41.974
jan 1, 2016
At the date of observation
Value
Absolute change
Change from previous value
jan 1, 1962
11.624
+11.624
0.0%
jan 1, 1963
11.934
+0.31
2.66%
jan 1, 1964
12.252
+0.319
2.67%
jan 1, 1965
12.581
+0.329
2.68%
jan 1, 1966
12.921
+0.34
2.7%
jan 1, 1967
13.273
+0.352
2.72%
jan 1, 1968
13.637
+0.364
2.74%
jan 1, 1969
14.01
+0.373
2.73%
jan 1, 1970
14.387
+0.378
2.7%
jan 1, 1971
14.768
+0.38
2.64%
jan 1, 1972
15.15
+0.382
2.59%
jan 1, 1973
15.536
+0.386
2.55%
jan 1, 1974
15.932
+0.396
2.55%
jan 1, 1975
16.344
+0.412
2.58%
jan 1, 1976
16.777
+0.433
2.65%
jan 1, 1977
17.232
+0.455
2.71%
jan 1, 1978
17.709
+0.477
2.77%
jan 1, 1979
18.212
+0.503
2.84%
jan 1, 1980
18.745
+0.533
2.93%
jan 1, 1981
19.311
+0.566
3.02%
jan 1, 1982
19.909
+0.599
3.1%
jan 1, 1983
20.538
+0.629
3.16%
jan 1, 1984
21.192
+0.654
3.18%
jan 1, 1985
21.864
+0.672
3.17%
jan 1, 1986
22.546
+0.683
3.12%
jan 1, 1987
23.239
+0.692
3.07%
jan 1, 1988
23.939
+0.7
3.01%
jan 1, 1989
24.637
+0.698
2.92%
jan 1, 1990
25.321
+0.684
2.78%
jan 1, 1991
26.213
+0.892
3.52%
jan 1, 1992
26.859
+0.647
2.47%
jan 1, 1993
27.482
+0.623
2.32%
jan 1, 1994
28.088
+0.605
2.2%
jan 1, 1995
28.685
+0.598
2.13%
jan 1, 1996
29.283
+0.597
2.08%
jan 1, 1997
29.883
+0.6
2.05%
jan 1, 1998
30.484
+0.601
2.01%
jan 1, 1999
31.077
+0.594
1.95%
jan 1, 2000
31.665
+0.588
1.89%
jan 1, 2001
32.245
+0.58
1.83%
jan 1, 2002
32.817
+0.572
1.77%
jan 1, 2003
33.384
+0.567
1.73%
jan 1, 2004
33.954
+0.57
1.71%
jan 1, 2005
34.535
+0.581
1.71%
jan 1, 2006
35.135
+0.6
1.74%
jan 1, 2007
35.756
+0.621
1.77%
jan 1, 2008
36.397
+0.641
1.79%
jan 1, 2009
37.056
+0.66
1.81%
jan 1, 2010
37.74
+0.684
1.85%
jan 1, 2011
38.423
+0.682
1.81%
jan 1, 2012
39.114
+0.691
1.8%
jan 1, 2013
39.814
+0.7
1.79%
jan 1, 2014
40.524
+0.71
1.78%
jan 1, 2015
41.243
+0.72
1.78%
jan 1, 2016
41.974
+0.73
1.77%
Ranking of countries by current statistics by years


Comments: