29
/
en
AIzaSyAYiBZKx7MnpbEhh9jyipgxe19OcubqV5w
April 1, 2024
220029
Papua New Guinea
PNG
true
2
1
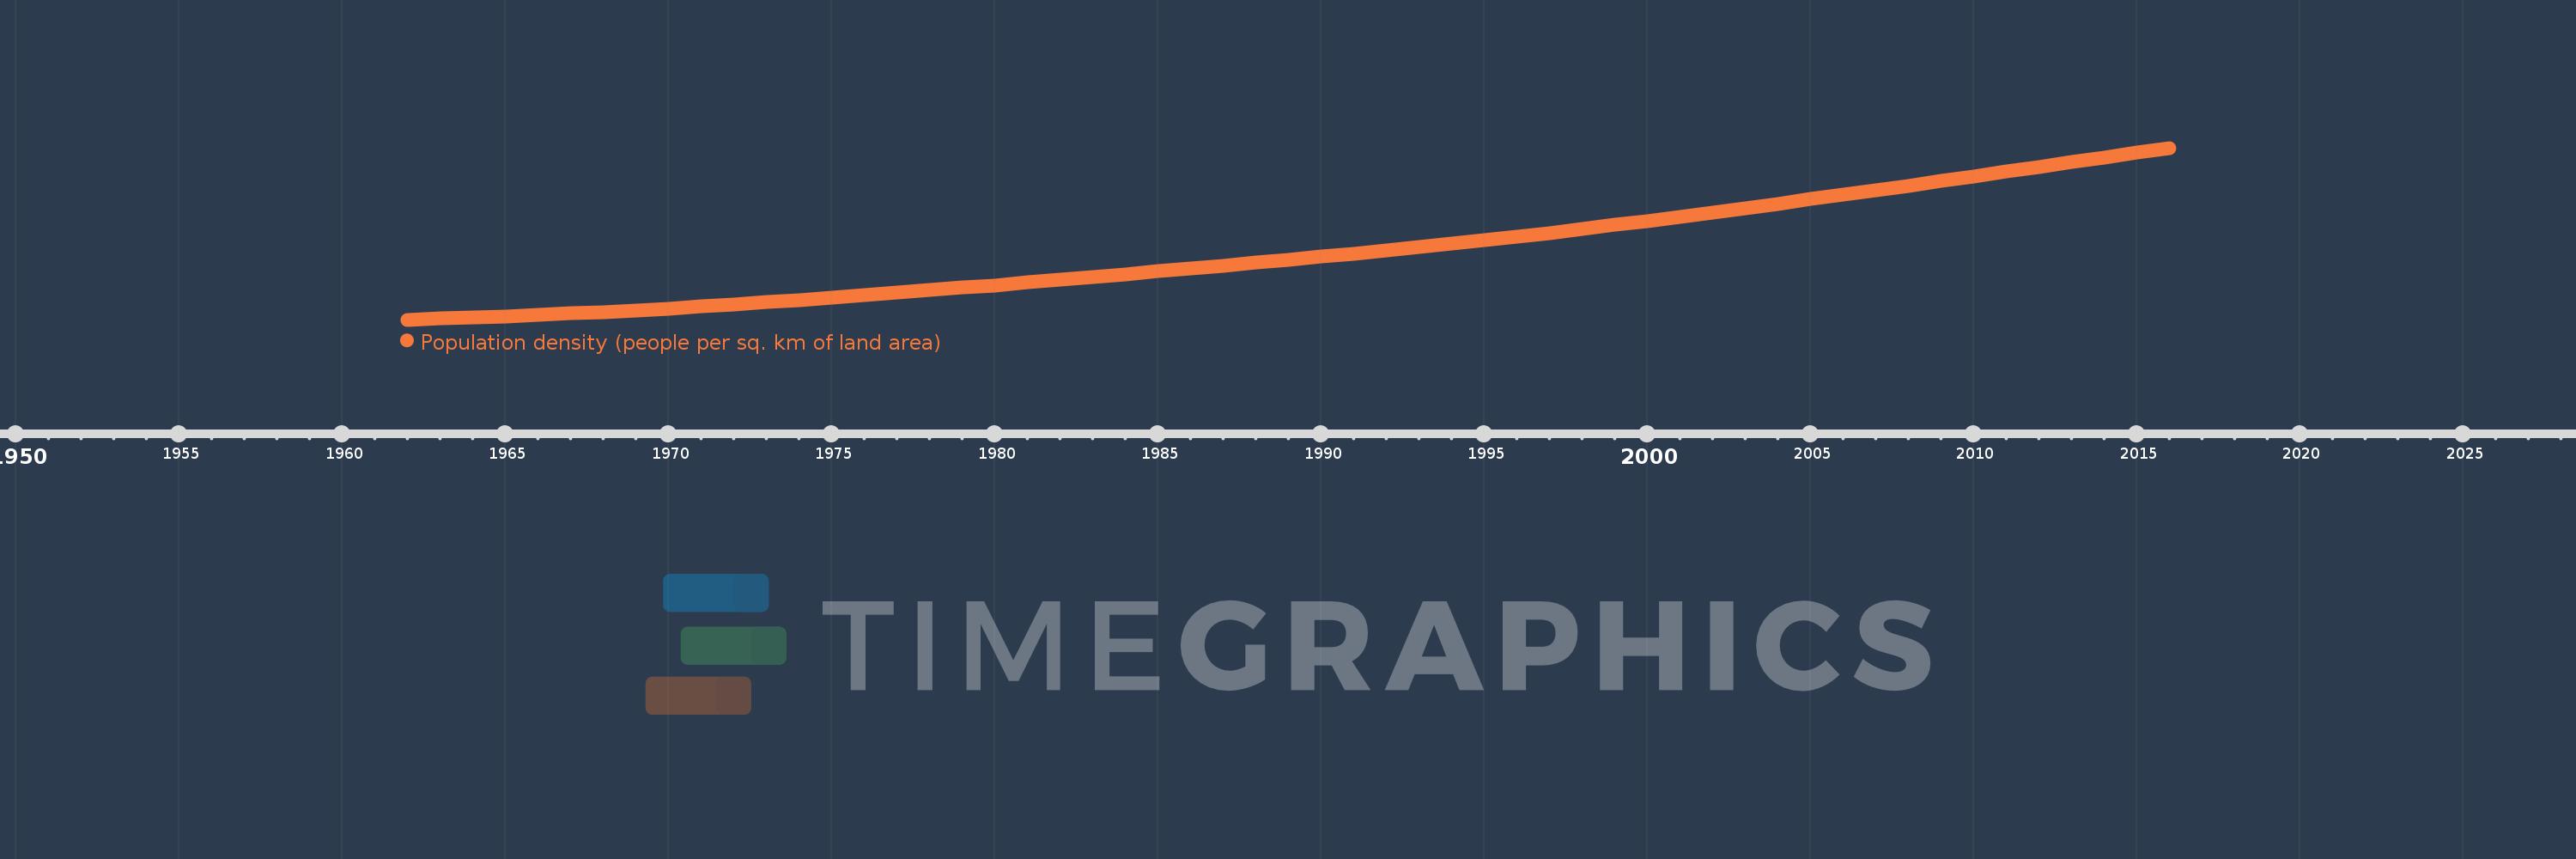
Population density (people per sq. km of land area)
2016,2015,2014,2013,2012,2011,2010,2009,2008,2007,2006,2005,2004,2003,2002,2001,2000,1999,1998,1997,1996,1995,1994,1993,1992,1991,1990,1989,1988,1987,1986,1985,1984,1983,1982,1981,1980,1979,1978,1977,1976,1975,1974,1973,1972,1971,1970,1969,1968,1967,1966,1965,1964,1963,1962
This statistics in other country:
AfghanistanAlbaniaAlgeriaAmerican SamoaAndorraAngolaAntigua and BarbudaArab WorldArgentinaArmeniaArubaAustraliaAustriaAzerbaijanBahamas, TheBahrainBangladeshBarbadosBelarusBelgiumBelizeBeninBermudaBhutanBoliviaBosnia and HerzegovinaBotswanaBrazilBritish Virgin IslandsBrunei DarussalamBulgariaBurkina FasoBurundiCabo VerdeCambodiaCameroonCanadaCaribbean small statesCayman IslandsCentral African RepublicCentral Europe and the BalticsChadChannel IslandsChileChinaColombiaComorosCongo, Dem. Rep.Congo, Rep.Costa RicaCote d'IvoireCroatiaCubaCuracaoCyprusCzech RepublicDenmarkDjiboutiDominicaDominican RepublicEarly-demographic dividendEast Asia & PacificEast Asia & Pacific (excluding high income)East Asia & Pacific (IDA & IBRD countries)EcuadorEgypt, Arab Rep.El SalvadorEquatorial GuineaEritreaEstoniaEthiopiaEuro areaEurope & Central AsiaEurope & Central Asia (excluding high income)Europe & Central Asia (IDA & IBRD countries)European UnionFaroe IslandsFijiFinlandFragile and conflict affected situationsFranceFrench PolynesiaGabonGambia, TheGeorgiaGermanyGhanaGibraltarGreeceGreenlandGrenadaGuamGuatemalaGuineaGuinea-BissauGuyanaHaitiHeavily indebted poor countries (HIPC)High incomeHondurasHong Kong SAR, ChinaHungaryIBRD onlyIcelandIDA & IBRD totalIDA blendIDA onlyIDA totalIndiaIndonesiaIran, Islamic Rep.IraqIrelandIsle of ManIsraelItalyJamaicaJapanJordanKazakhstanKenyaKiribatiKorea, Dem. People’s Rep.Korea, Rep.KosovoKuwaitKyrgyz RepublicLao PDRLate-demographic dividendLatin America & Caribbean Latin America & Caribbean (excluding high income)Latin America & the Caribbean (IDA & IBRD countries)LatviaLeast developed countries: UN classificationLebanonLesothoLiberiaLibyaLiechtensteinLithuaniaLow & middle incomeLow incomeLower middle incomeLuxembourgMacao SAR, ChinaMacedonia, FYRMadagascarMalawiMalaysiaMaldivesMaliMaltaMarshall IslandsMauritaniaMauritiusMexicoMicronesia, Fed. Sts.Middle East & North AfricaMiddle East & North Africa (excluding high income)Middle East & North Africa (IDA & IBRD countries)Middle incomeMoldovaMonacoMongoliaMontenegroMoroccoMozambiqueMyanmarNamibiaNauruNepalNetherlandsNew CaledoniaNew ZealandNicaraguaNigerNigeriaNorth AmericaNorthern Mariana IslandsNorwayOECD membersOmanOther small statesPacific island small statesPakistanPalauPanamaPapua New GuineaParaguayPeruPhilippinesPolandPortugalPost-demographic dividendPre-demographic dividendPuerto RicoQatarRomaniaRussian FederationRwandaSamoaSan MarinoSao Tome and PrincipeSaudi ArabiaSenegalSerbiaSeychellesSierra LeoneSingaporeSint Maarten (Dutch part)Slovak RepublicSloveniaSmall statesSolomon IslandsSomaliaSouth AfricaSouth AsiaSouth Asia (IDA & IBRD)SpainSri LankaSt. Kitts and NevisSt. LuciaSt. Martin (French part)St. Vincent and the GrenadinesSub-Saharan Africa Sub-Saharan Africa (excluding high income)Sub-Saharan Africa (IDA & IBRD countries)SudanSurinameSwazilandSwedenSwitzerlandSyrian Arab RepublicTajikistanTanzaniaThailandTimor-LesteTogoTongaTrinidad and TobagoTunisiaTurkeyTurkmenistanTurks and Caicos IslandsTuvaluUgandaUkraineUnited Arab EmiratesUnited KingdomUnited StatesUpper middle incomeUruguayUzbekistanVanuatuVenezuela, RBVietnamVirgin Islands (U.S.)West Bank and GazaWorldYemen, Rep.ZambiaZimbabwe Timeline:
This timeline shows a graph from 1962 to 2016 of Papua New Guinea. No data until 1961. Number of actual observations by date: 55.
Source name:
World Development Indicators
Source organization:
Food and Agriculture Organization and World Bank population estimates.
Categories, topics:
Urban Development
Last updated:
apr 23, 2017
Indicators value changes by year
Maximum:
16.825
jan 1, 2016
At the date of observation
Value
Absolute change
Change from previous value
jan 1, 1962
4.419
+4.419
0.0%
jan 1, 1963
4.498
+0.08
1.8%
jan 1, 1964
4.583
+0.085
1.89%
jan 1, 1965
4.674
+0.091
1.99%
jan 1, 1966
4.772
+0.098
2.09%
jan 1, 1967
4.877
+0.104
2.19%
jan 1, 1968
4.988
+0.111
2.28%
jan 1, 1969
5.108
+0.12
2.4%
jan 1, 1970
5.237
+0.129
2.53%
jan 1, 1971
5.376
+0.14
2.67%
jan 1, 1972
5.527
+0.151
2.81%
jan 1, 1973
5.688
+0.161
2.92%
jan 1, 1974
5.857
+0.169
2.97%
jan 1, 1975
6.03
+0.173
2.95%
jan 1, 1976
6.204
+0.174
2.89%
jan 1, 1977
6.378
+0.174
2.81%
jan 1, 1978
6.553
+0.175
2.74%
jan 1, 1979
6.73
+0.177
2.7%
jan 1, 1980
6.912
+0.182
2.7%
jan 1, 1981
7.1
+0.188
2.73%
jan 1, 1982
7.296
+0.196
2.76%
jan 1, 1983
7.499
+0.202
2.77%
jan 1, 1984
7.705
+0.207
2.76%
jan 1, 1985
7.913
+0.208
2.7%
jan 1, 1986
8.121
+0.208
2.63%
jan 1, 1987
8.328
+0.207
2.55%
jan 1, 1988
8.536
+0.207
2.49%
jan 1, 1989
8.745
+0.209
2.45%
jan 1, 1990
8.96
+0.215
2.45%
jan 1, 1991
9.181
+0.222
2.48%
jan 1, 1992
9.411
+0.23
2.5%
jan 1, 1993
9.648
+0.237
2.52%
jan 1, 1994
9.894
+0.246
2.55%
jan 1, 1995
10.149
+0.255
2.58%
jan 1, 1996
10.414
+0.265
2.61%
jan 1, 1997
10.688
+0.275
2.64%
jan 1, 1998
10.973
+0.284
2.66%
jan 1, 1999
11.265
+0.293
2.67%
jan 1, 2000
11.564
+0.299
2.65%
jan 1, 2001
11.867
+0.303
2.62%
jan 1, 2002
12.173
+0.306
2.58%
jan 1, 2003
12.484
+0.31
2.55%
jan 1, 2004
12.798
+0.314
2.52%
jan 1, 2005
13.117
+0.319
2.49%
jan 1, 2006
13.441
+0.324
2.47%
jan 1, 2007
13.771
+0.33
2.45%
jan 1, 2008
14.105
+0.334
2.43%
jan 1, 2009
14.442
+0.337
2.39%
jan 1, 2010
14.781
+0.339
2.35%
jan 1, 2011
15.121
+0.339
2.3%
jan 1, 2012
15.46
+0.339
2.24%
jan 1, 2013
15.799
+0.339
2.2%
jan 1, 2014
16.139
+0.34
2.15%
jan 1, 2015
16.481
+0.342
2.12%
jan 1, 2016
16.825
+0.344
2.09%
Ranking of countries by current statistics by years


Comments: