29
/
en
AIzaSyAYiBZKx7MnpbEhh9jyipgxe19OcubqV5w
April 1, 2024
206232
Nauru
NRU
true
2
1
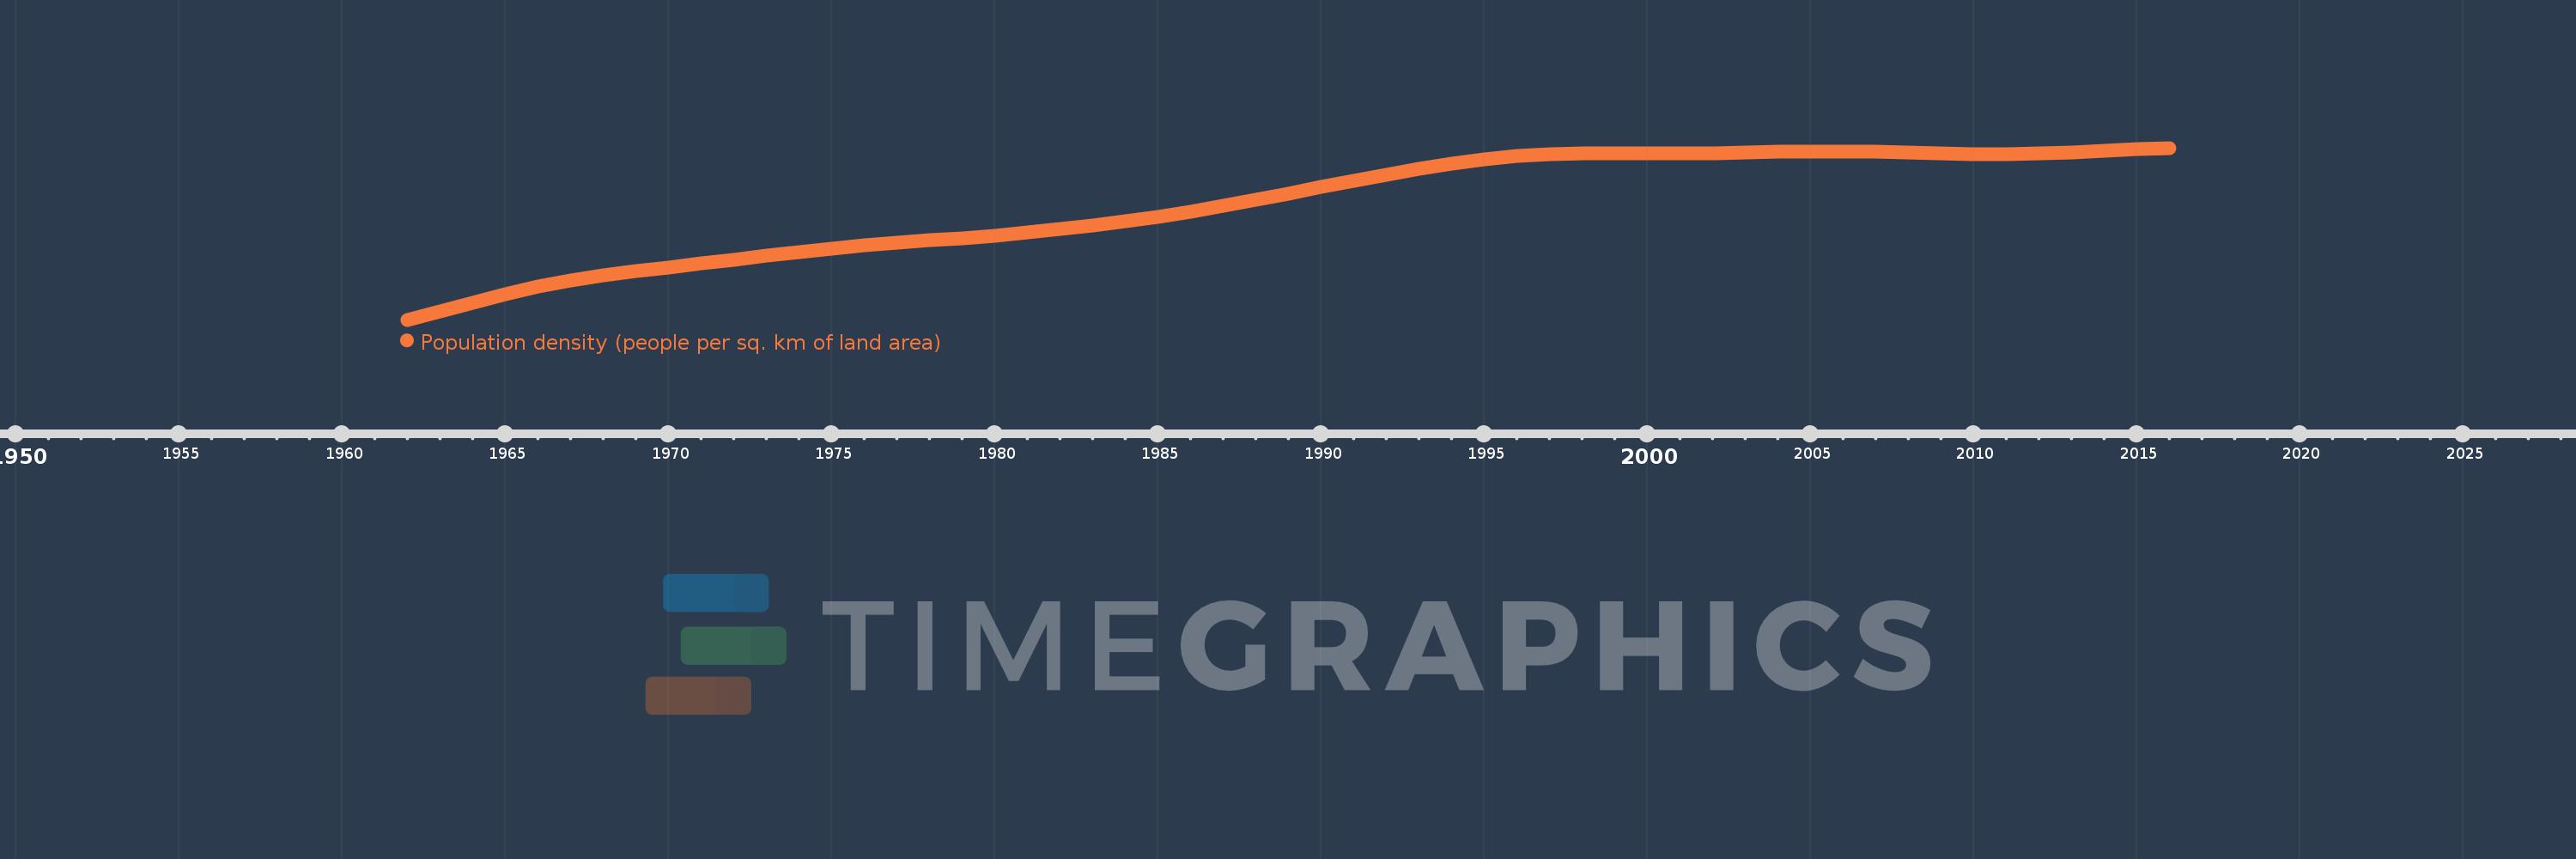
Population density (people per sq. km of land area)
2016,2015,2014,2013,2012,2011,2010,2009,2008,2007,2006,2005,2004,2003,2002,2001,2000,1999,1998,1997,1996,1995,1994,1993,1992,1991,1990,1989,1988,1987,1986,1985,1984,1983,1982,1981,1980,1979,1978,1977,1976,1975,1974,1973,1972,1971,1970,1969,1968,1967,1966,1965,1964,1963,1962
This statistics in other country:
AfghanistanAlbaniaAlgeriaAmerican SamoaAndorraAngolaAntigua and BarbudaArab WorldArgentinaArmeniaArubaAustraliaAustriaAzerbaijanBahamas, TheBahrainBangladeshBarbadosBelarusBelgiumBelizeBeninBermudaBhutanBoliviaBosnia and HerzegovinaBotswanaBrazilBritish Virgin IslandsBrunei DarussalamBulgariaBurkina FasoBurundiCabo VerdeCambodiaCameroonCanadaCaribbean small statesCayman IslandsCentral African RepublicCentral Europe and the BalticsChadChannel IslandsChileChinaColombiaComorosCongo, Dem. Rep.Congo, Rep.Costa RicaCote d'IvoireCroatiaCubaCuracaoCyprusCzech RepublicDenmarkDjiboutiDominicaDominican RepublicEarly-demographic dividendEast Asia & PacificEast Asia & Pacific (excluding high income)East Asia & Pacific (IDA & IBRD countries)EcuadorEgypt, Arab Rep.El SalvadorEquatorial GuineaEritreaEstoniaEthiopiaEuro areaEurope & Central AsiaEurope & Central Asia (excluding high income)Europe & Central Asia (IDA & IBRD countries)European UnionFaroe IslandsFijiFinlandFragile and conflict affected situationsFranceFrench PolynesiaGabonGambia, TheGeorgiaGermanyGhanaGibraltarGreeceGreenlandGrenadaGuamGuatemalaGuineaGuinea-BissauGuyanaHaitiHeavily indebted poor countries (HIPC)High incomeHondurasHong Kong SAR, ChinaHungaryIBRD onlyIcelandIDA & IBRD totalIDA blendIDA onlyIDA totalIndiaIndonesiaIran, Islamic Rep.IraqIrelandIsle of ManIsraelItalyJamaicaJapanJordanKazakhstanKenyaKiribatiKorea, Dem. People’s Rep.Korea, Rep.KosovoKuwaitKyrgyz RepublicLao PDRLate-demographic dividendLatin America & Caribbean Latin America & Caribbean (excluding high income)Latin America & the Caribbean (IDA & IBRD countries)LatviaLeast developed countries: UN classificationLebanonLesothoLiberiaLibyaLiechtensteinLithuaniaLow & middle incomeLow incomeLower middle incomeLuxembourgMacao SAR, ChinaMacedonia, FYRMadagascarMalawiMalaysiaMaldivesMaliMaltaMarshall IslandsMauritaniaMauritiusMexicoMicronesia, Fed. Sts.Middle East & North AfricaMiddle East & North Africa (excluding high income)Middle East & North Africa (IDA & IBRD countries)Middle incomeMoldovaMonacoMongoliaMontenegroMoroccoMozambiqueMyanmarNamibiaNauruNepalNetherlandsNew CaledoniaNew ZealandNicaraguaNigerNigeriaNorth AmericaNorthern Mariana IslandsNorwayOECD membersOmanOther small statesPacific island small statesPakistanPalauPanamaPapua New GuineaParaguayPeruPhilippinesPolandPortugalPost-demographic dividendPre-demographic dividendPuerto RicoQatarRomaniaRussian FederationRwandaSamoaSan MarinoSao Tome and PrincipeSaudi ArabiaSenegalSerbiaSeychellesSierra LeoneSingaporeSint Maarten (Dutch part)Slovak RepublicSloveniaSmall statesSolomon IslandsSomaliaSouth AfricaSouth AsiaSouth Asia (IDA & IBRD)SpainSri LankaSt. Kitts and NevisSt. LuciaSt. Martin (French part)St. Vincent and the GrenadinesSub-Saharan Africa Sub-Saharan Africa (excluding high income)Sub-Saharan Africa (IDA & IBRD countries)SudanSurinameSwazilandSwedenSwitzerlandSyrian Arab RepublicTajikistanTanzaniaThailandTimor-LesteTogoTongaTrinidad and TobagoTunisiaTurkeyTurkmenistanTurks and Caicos IslandsTuvaluUgandaUkraineUnited Arab EmiratesUnited KingdomUnited StatesUpper middle incomeUruguayUzbekistanVanuatuVenezuela, RBVietnamVirgin Islands (U.S.)West Bank and GazaWorldYemen, Rep.ZambiaZimbabwe Timeline:
This timeline shows a graph from 1962 to 2016 of Nauru. No data until 1961. Number of actual observations by date: 55.
Source name:
World Development Indicators
Source organization:
Food and Agriculture Organization and World Bank population estimates.
Categories, topics:
Urban Development
Last updated:
apr 23, 2017
Indicators value changes by year
Minimum:
233.75
jan 1, 1962
At the date of observation
Value
Absolute change
Change from previous value
jan 1, 1962
233.75
+233.75
0.0%
jan 1, 1963
247.35
+13.6
5.82%
jan 1, 1964
261.55
+14.2
5.74%
jan 1, 1965
275.0
+13.45
5.14%
jan 1, 1966
286.9
+11.9
4.33%
jan 1, 1967
296.8
+9.9
3.45%
jan 1, 1968
305.1
+8.3
2.8%
jan 1, 1969
312.05
+6.95
2.28%
jan 1, 1970
318.4
+6.35
2.03%
jan 1, 1971
324.65
+6.25
1.96%
jan 1, 1972
330.95
+6.3
1.94%
jan 1, 1973
337.15
+6.2
1.87%
jan 1, 1974
343.1
+5.95
1.76%
jan 1, 1975
348.6
+5.5
1.6%
jan 1, 1976
353.5
+4.9
1.41%
jan 1, 1977
357.8
+4.3
1.22%
jan 1, 1978
361.75
+3.95
1.1%
jan 1, 1979
365.55
+3.8
1.05%
jan 1, 1980
369.65
+4.1
1.12%
jan 1, 1981
374.4
+4.75
1.28%
jan 1, 1982
379.85
+5.45
1.46%
jan 1, 1983
385.95
+6.1
1.61%
jan 1, 1984
392.75
+6.8
1.76%
jan 1, 1985
400.35
+7.6
1.94%
jan 1, 1986
408.7
+8.35
2.09%
jan 1, 1987
417.8
+9.1
2.23%
jan 1, 1988
427.5
+9.7
2.32%
jan 1, 1989
437.6
+10.1
2.36%
jan 1, 1990
447.8
+10.2
2.33%
jan 1, 1991
457.85
+10.05
2.24%
jan 1, 1992
467.7
+9.85
2.15%
jan 1, 1993
477.2
+9.5
2.03%
jan 1, 1994
485.95
+8.75
1.83%
jan 1, 1995
493.15
+7.2
1.48%
jan 1, 1996
498.5
+5.35
1.08%
jan 1, 1997
501.65
+3.15
0.63%
jan 1, 1998
502.8
+1.15
0.23%
jan 1, 1999
502.7
-0.1
-0.02%
jan 1, 2000
502.2
-0.5
-0.1%
jan 1, 2001
502.1
-0.1
-0.02%
jan 1, 2002
502.65
+0.55
0.11%
jan 1, 2003
503.65
+1.0
0.2%
jan 1, 2004
504.8
+1.15
0.23%
jan 1, 2005
505.65
+0.85
0.17%
jan 1, 2006
505.75
+0.1
0.02%
jan 1, 2007
505.05
-0.7
-0.14%
jan 1, 2008
503.75
-1.3
-0.26%
jan 1, 2009
502.35
-1.4
-0.28%
jan 1, 2010
501.4
-0.95
-0.19%
jan 1, 2011
501.25
-0.15
-0.03%
jan 1, 2012
502.15
+0.9
0.18%
jan 1, 2013
503.95
+1.8
0.36%
jan 1, 2014
506.25
+2.3
0.46%
jan 1, 2015
508.8
+2.55
0.5%
jan 1, 2016
511.1
+2.3
0.45%
Ranking of countries by current statistics by years


Comments: