29
/
en
AIzaSyAYiBZKx7MnpbEhh9jyipgxe19OcubqV5w
April 1, 2024
110147
Congo, Dem. Rep.
COD
true
2
1
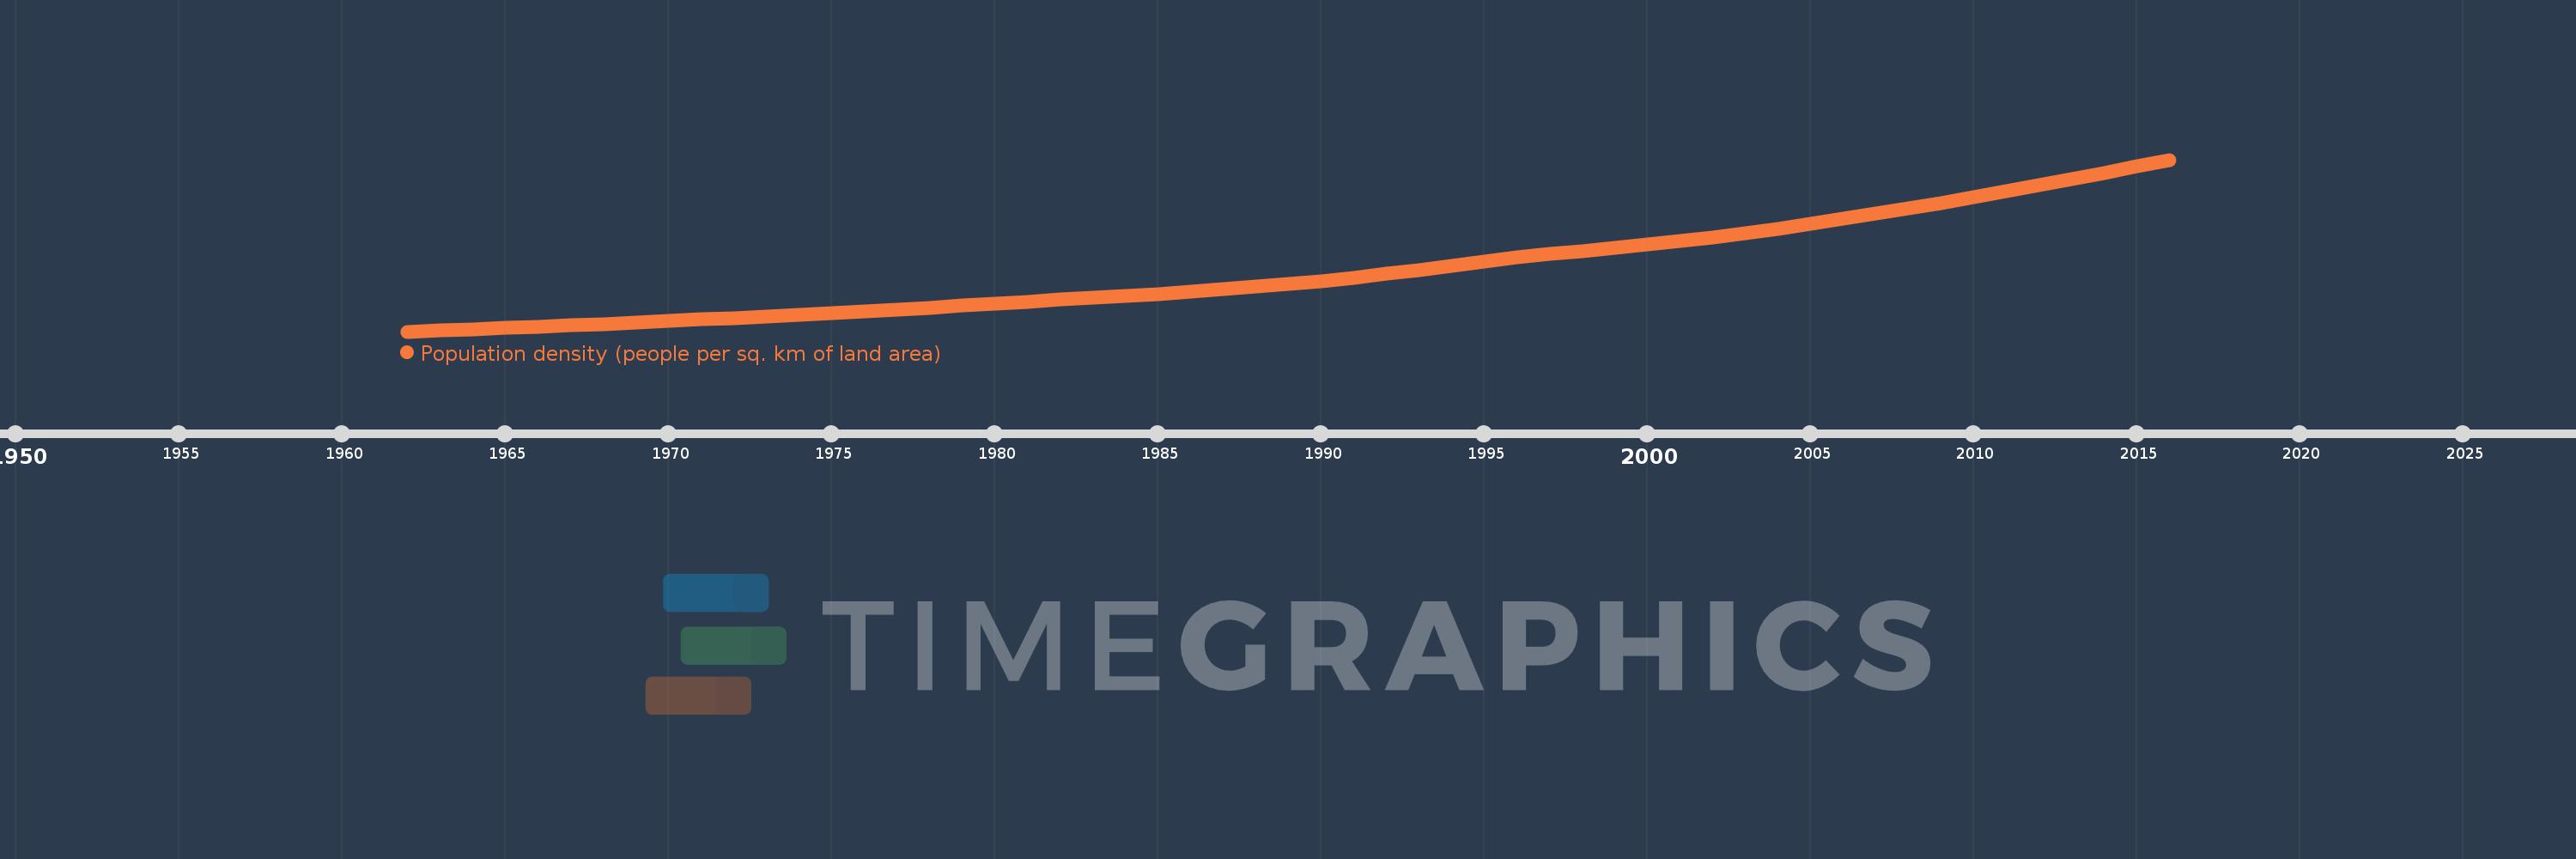
Population density (people per sq. km of land area)
2016,2015,2014,2013,2012,2011,2010,2009,2008,2007,2006,2005,2004,2003,2002,2001,2000,1999,1998,1997,1996,1995,1994,1993,1992,1991,1990,1989,1988,1987,1986,1985,1984,1983,1982,1981,1980,1979,1978,1977,1976,1975,1974,1973,1972,1971,1970,1969,1968,1967,1966,1965,1964,1963,1962
This statistics in other country:
AfghanistanAlbaniaAlgeriaAmerican SamoaAndorraAngolaAntigua and BarbudaArab WorldArgentinaArmeniaArubaAustraliaAustriaAzerbaijanBahamas, TheBahrainBangladeshBarbadosBelarusBelgiumBelizeBeninBermudaBhutanBoliviaBosnia and HerzegovinaBotswanaBrazilBritish Virgin IslandsBrunei DarussalamBulgariaBurkina FasoBurundiCabo VerdeCambodiaCameroonCanadaCaribbean small statesCayman IslandsCentral African RepublicCentral Europe and the BalticsChadChannel IslandsChileChinaColombiaComorosCongo, Dem. Rep.Congo, Rep.Costa RicaCote d'IvoireCroatiaCubaCuracaoCyprusCzech RepublicDenmarkDjiboutiDominicaDominican RepublicEarly-demographic dividendEast Asia & PacificEast Asia & Pacific (excluding high income)East Asia & Pacific (IDA & IBRD countries)EcuadorEgypt, Arab Rep.El SalvadorEquatorial GuineaEritreaEstoniaEthiopiaEuro areaEurope & Central AsiaEurope & Central Asia (excluding high income)Europe & Central Asia (IDA & IBRD countries)European UnionFaroe IslandsFijiFinlandFragile and conflict affected situationsFranceFrench PolynesiaGabonGambia, TheGeorgiaGermanyGhanaGibraltarGreeceGreenlandGrenadaGuamGuatemalaGuineaGuinea-BissauGuyanaHaitiHeavily indebted poor countries (HIPC)High incomeHondurasHong Kong SAR, ChinaHungaryIBRD onlyIcelandIDA & IBRD totalIDA blendIDA onlyIDA totalIndiaIndonesiaIran, Islamic Rep.IraqIrelandIsle of ManIsraelItalyJamaicaJapanJordanKazakhstanKenyaKiribatiKorea, Dem. People’s Rep.Korea, Rep.KosovoKuwaitKyrgyz RepublicLao PDRLate-demographic dividendLatin America & Caribbean Latin America & Caribbean (excluding high income)Latin America & the Caribbean (IDA & IBRD countries)LatviaLeast developed countries: UN classificationLebanonLesothoLiberiaLibyaLiechtensteinLithuaniaLow & middle incomeLow incomeLower middle incomeLuxembourgMacao SAR, ChinaMacedonia, FYRMadagascarMalawiMalaysiaMaldivesMaliMaltaMarshall IslandsMauritaniaMauritiusMexicoMicronesia, Fed. Sts.Middle East & North AfricaMiddle East & North Africa (excluding high income)Middle East & North Africa (IDA & IBRD countries)Middle incomeMoldovaMonacoMongoliaMontenegroMoroccoMozambiqueMyanmarNamibiaNauruNepalNetherlandsNew CaledoniaNew ZealandNicaraguaNigerNigeriaNorth AmericaNorthern Mariana IslandsNorwayOECD membersOmanOther small statesPacific island small statesPakistanPalauPanamaPapua New GuineaParaguayPeruPhilippinesPolandPortugalPost-demographic dividendPre-demographic dividendPuerto RicoQatarRomaniaRussian FederationRwandaSamoaSan MarinoSao Tome and PrincipeSaudi ArabiaSenegalSerbiaSeychellesSierra LeoneSingaporeSint Maarten (Dutch part)Slovak RepublicSloveniaSmall statesSolomon IslandsSomaliaSouth AfricaSouth AsiaSouth Asia (IDA & IBRD)SpainSri LankaSt. Kitts and NevisSt. LuciaSt. Martin (French part)St. Vincent and the GrenadinesSub-Saharan Africa Sub-Saharan Africa (excluding high income)Sub-Saharan Africa (IDA & IBRD countries)SudanSurinameSwazilandSwedenSwitzerlandSyrian Arab RepublicTajikistanTanzaniaThailandTimor-LesteTogoTongaTrinidad and TobagoTunisiaTurkeyTurkmenistanTurks and Caicos IslandsTuvaluUgandaUkraineUnited Arab EmiratesUnited KingdomUnited StatesUpper middle incomeUruguayUzbekistanVanuatuVenezuela, RBVietnamVirgin Islands (U.S.)West Bank and GazaWorldYemen, Rep.ZambiaZimbabwe Timeline:
This timeline shows a graph from 1962 to 2016 of Congo, Dem. Rep.. No data until 1961. Number of actual observations by date: 55.
Source name:
World Development Indicators
Source organization:
Food and Agriculture Organization and World Bank population estimates.
Categories, topics:
Urban Development
Last updated:
apr 23, 2017
Indicators value changes by year
Maximum:
34.083
jan 1, 2016
At the date of observation
Value
Absolute change
Change from previous value
jan 1, 1962
6.898
+6.898
0.0%
jan 1, 1963
7.076
+0.178
2.58%
jan 1, 1964
7.261
+0.186
2.62%
jan 1, 1965
7.456
+0.195
2.68%
jan 1, 1966
7.662
+0.206
2.76%
jan 1, 1967
7.879
+0.217
2.83%
jan 1, 1968
8.107
+0.228
2.89%
jan 1, 1969
8.343
+0.236
2.91%
jan 1, 1970
8.583
+0.241
2.89%
jan 1, 1971
8.826
+0.243
2.83%
jan 1, 1972
9.07
+0.244
2.76%
jan 1, 1973
9.317
+0.246
2.71%
jan 1, 1974
9.568
+0.251
2.7%
jan 1, 1975
9.829
+0.261
2.73%
jan 1, 1976
10.102
+0.274
2.78%
jan 1, 1977
10.391
+0.289
2.86%
jan 1, 1978
10.693
+0.303
2.91%
jan 1, 1979
11.005
+0.311
2.91%
jan 1, 1980
11.317
+0.312
2.84%
jan 1, 1981
11.626
+0.309
2.73%
jan 1, 1982
11.931
+0.305
2.62%
jan 1, 1983
12.237
+0.305
2.56%
jan 1, 1984
12.549
+0.312
2.55%
jan 1, 1985
12.876
+0.328
2.61%
jan 1, 1986
13.227
+0.351
2.72%
jan 1, 1987
13.599
+0.372
2.81%
jan 1, 1988
13.992
+0.394
2.89%
jan 1, 1989
14.419
+0.427
3.05%
jan 1, 1990
14.893
+0.474
3.29%
jan 1, 1991
15.422
+0.529
3.55%
jan 1, 1992
16.016
+0.594
3.85%
jan 1, 1993
16.667
+0.65
4.06%
jan 1, 1994
17.342
+0.675
4.05%
jan 1, 1995
17.999
+0.657
3.79%
jan 1, 1996
18.607
+0.609
3.38%
jan 1, 1997
19.155
+0.548
2.94%
jan 1, 1998
19.655
+0.5
2.61%
jan 1, 1999
20.135
+0.481
2.45%
jan 1, 2000
20.638
+0.503
2.5%
jan 1, 2001
21.194
+0.556
2.69%
jan 1, 2002
21.812
+0.618
2.91%
jan 1, 2003
22.484
+0.672
3.08%
jan 1, 2004
23.203
+0.719
3.2%
jan 1, 2005
23.958
+0.755
3.26%
jan 1, 2006
24.741
+0.783
3.27%
jan 1, 2007
25.552
+0.81
3.28%
jan 1, 2008
26.393
+0.842
3.29%
jan 1, 2009
27.264
+0.871
3.3%
jan 1, 2010
28.162
+0.898
3.29%
jan 1, 2011
29.086
+0.923
3.28%
jan 1, 2012
30.033
+0.948
3.26%
jan 1, 2013
31.006
+0.972
3.24%
jan 1, 2014
32.003
+0.998
3.22%
jan 1, 2015
33.028
+1.025
3.2%
jan 1, 2016
34.083
+1.054
3.19%
Ranking of countries by current statistics by years


Comments: