29
/
en
AIzaSyAYiBZKx7MnpbEhh9jyipgxe19OcubqV5w
April 1, 2024
50371
Middle East & North Africa (IDA & IBRD countries)
TMN
false
2
1
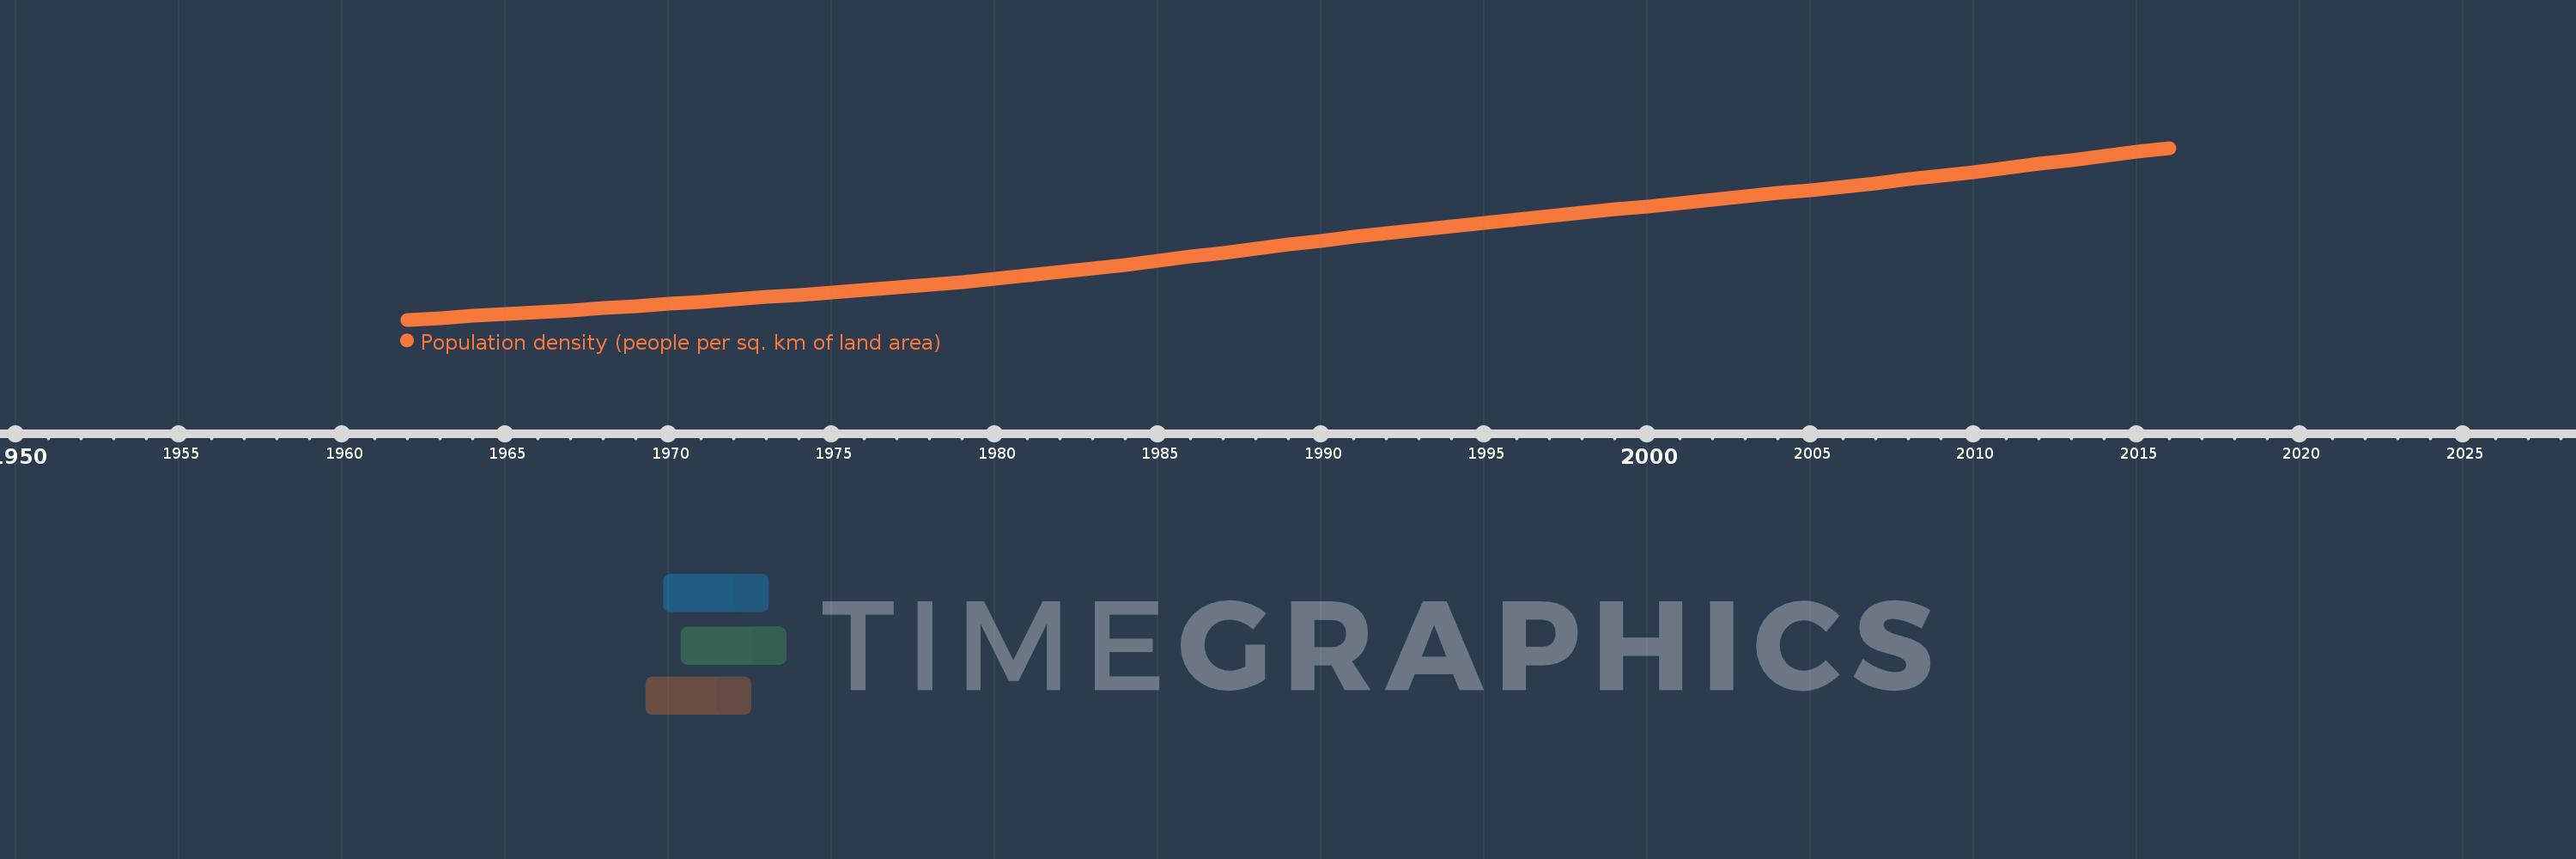
Population density (people per sq. km of land area)
2016,2015,2014,2013,2012,2011,2010,2009,2008,2007,2006,2005,2004,2003,2002,2001,2000,1999,1998,1997,1996,1995,1994,1993,1992,1991,1990,1989,1988,1987,1986,1985,1984,1983,1982,1981,1980,1979,1978,1977,1976,1975,1974,1973,1972,1971,1970,1969,1968,1967,1966,1965,1964,1963,1962
This statistics in other country:
AfghanistanAlbaniaAlgeriaAmerican SamoaAndorraAngolaAntigua and BarbudaArab WorldArgentinaArmeniaArubaAustraliaAustriaAzerbaijanBahamas, TheBahrainBangladeshBarbadosBelarusBelgiumBelizeBeninBermudaBhutanBoliviaBosnia and HerzegovinaBotswanaBrazilBritish Virgin IslandsBrunei DarussalamBulgariaBurkina FasoBurundiCabo VerdeCambodiaCameroonCanadaCaribbean small statesCayman IslandsCentral African RepublicCentral Europe and the BalticsChadChannel IslandsChileChinaColombiaComorosCongo, Dem. Rep.Congo, Rep.Costa RicaCote d'IvoireCroatiaCubaCuracaoCyprusCzech RepublicDenmarkDjiboutiDominicaDominican RepublicEarly-demographic dividendEast Asia & PacificEast Asia & Pacific (excluding high income)East Asia & Pacific (IDA & IBRD countries)EcuadorEgypt, Arab Rep.El SalvadorEquatorial GuineaEritreaEstoniaEthiopiaEuro areaEurope & Central AsiaEurope & Central Asia (excluding high income)Europe & Central Asia (IDA & IBRD countries)European UnionFaroe IslandsFijiFinlandFragile and conflict affected situationsFranceFrench PolynesiaGabonGambia, TheGeorgiaGermanyGhanaGibraltarGreeceGreenlandGrenadaGuamGuatemalaGuineaGuinea-BissauGuyanaHaitiHeavily indebted poor countries (HIPC)High incomeHondurasHong Kong SAR, ChinaHungaryIBRD onlyIcelandIDA & IBRD totalIDA blendIDA onlyIDA totalIndiaIndonesiaIran, Islamic Rep.IraqIrelandIsle of ManIsraelItalyJamaicaJapanJordanKazakhstanKenyaKiribatiKorea, Dem. People’s Rep.Korea, Rep.KosovoKuwaitKyrgyz RepublicLao PDRLate-demographic dividendLatin America & Caribbean Latin America & Caribbean (excluding high income)Latin America & the Caribbean (IDA & IBRD countries)LatviaLeast developed countries: UN classificationLebanonLesothoLiberiaLibyaLiechtensteinLithuaniaLow & middle incomeLow incomeLower middle incomeLuxembourgMacao SAR, ChinaMacedonia, FYRMadagascarMalawiMalaysiaMaldivesMaliMaltaMarshall IslandsMauritaniaMauritiusMexicoMicronesia, Fed. Sts.Middle East & North AfricaMiddle East & North Africa (excluding high income)Middle East & North Africa (IDA & IBRD countries)Middle incomeMoldovaMonacoMongoliaMontenegroMoroccoMozambiqueMyanmarNamibiaNauruNepalNetherlandsNew CaledoniaNew ZealandNicaraguaNigerNigeriaNorth AmericaNorthern Mariana IslandsNorwayOECD membersOmanOther small statesPacific island small statesPakistanPalauPanamaPapua New GuineaParaguayPeruPhilippinesPolandPortugalPost-demographic dividendPre-demographic dividendPuerto RicoQatarRomaniaRussian FederationRwandaSamoaSan MarinoSao Tome and PrincipeSaudi ArabiaSenegalSerbiaSeychellesSierra LeoneSingaporeSint Maarten (Dutch part)Slovak RepublicSloveniaSmall statesSolomon IslandsSomaliaSouth AfricaSouth AsiaSouth Asia (IDA & IBRD)SpainSri LankaSt. Kitts and NevisSt. LuciaSt. Martin (French part)St. Vincent and the GrenadinesSub-Saharan Africa Sub-Saharan Africa (excluding high income)Sub-Saharan Africa (IDA & IBRD countries)SudanSurinameSwazilandSwedenSwitzerlandSyrian Arab RepublicTajikistanTanzaniaThailandTimor-LesteTogoTongaTrinidad and TobagoTunisiaTurkeyTurkmenistanTurks and Caicos IslandsTuvaluUgandaUkraineUnited Arab EmiratesUnited KingdomUnited StatesUpper middle incomeUruguayUzbekistanVanuatuVenezuela, RBVietnamVirgin Islands (U.S.)West Bank and GazaWorldYemen, Rep.ZambiaZimbabwe Timeline:
This timeline shows a graph from 1962 to 2016 of Middle East & North Africa (IDA & IBRD countries). No data until 1961. Number of actual observations by date: 55.
Source name:
World Development Indicators
Source organization:
Food and Agriculture Organization and World Bank population estimates.
Categories, topics:
Urban Development
Last updated:
apr 23, 2017
Indicators value changes by year
Minimum:
11.632
jan 1, 1962
Maximum:
41.491
jan 1, 2016
At the date of observation
Value
Absolute change
Change from previous value
jan 1, 1962
11.632
+11.632
0.0%
jan 1, 1963
11.942
+0.31
2.66%
jan 1, 1964
12.261
+0.319
2.67%
jan 1, 1965
12.59
+0.329
2.68%
jan 1, 1966
12.93
+0.34
2.7%
jan 1, 1967
13.282
+0.352
2.72%
jan 1, 1968
13.646
+0.364
2.74%
jan 1, 1969
14.019
+0.373
2.73%
jan 1, 1970
14.398
+0.378
2.7%
jan 1, 1971
14.778
+0.38
2.64%
jan 1, 1972
15.16
+0.382
2.59%
jan 1, 1973
15.547
+0.387
2.55%
jan 1, 1974
15.943
+0.396
2.55%
jan 1, 1975
16.355
+0.412
2.58%
jan 1, 1976
16.789
+0.433
2.65%
jan 1, 1977
17.244
+0.455
2.71%
jan 1, 1978
17.722
+0.477
2.77%
jan 1, 1979
18.225
+0.503
2.84%
jan 1, 1980
18.758
+0.533
2.93%
jan 1, 1981
19.324
+0.566
3.02%
jan 1, 1982
19.923
+0.599
3.1%
jan 1, 1983
20.553
+0.629
3.16%
jan 1, 1984
21.207
+0.654
3.18%
jan 1, 1985
21.879
+0.672
3.17%
jan 1, 1986
22.562
+0.683
3.12%
jan 1, 1987
23.255
+0.693
3.07%
jan 1, 1988
23.955
+0.7
3.01%
jan 1, 1989
24.654
+0.698
2.92%
jan 1, 1990
25.339
+0.685
2.78%
jan 1, 1991
26.002
+0.663
2.62%
jan 1, 1992
26.639
+0.637
2.45%
jan 1, 1993
27.251
+0.612
2.3%
jan 1, 1994
27.845
+0.594
2.18%
jan 1, 1995
28.431
+0.586
2.1%
jan 1, 1996
29.016
+0.585
2.06%
jan 1, 1997
29.604
+0.587
2.02%
jan 1, 1998
30.192
+0.588
1.99%
jan 1, 1999
30.778
+0.586
1.94%
jan 1, 2000
31.358
+0.58
1.88%
jan 1, 2001
31.93
+0.572
1.82%
jan 1, 2002
32.493
+0.563
1.76%
jan 1, 2003
33.051
+0.558
1.72%
jan 1, 2004
33.612
+0.561
1.7%
jan 1, 2005
34.184
+0.572
1.7%
jan 1, 2006
34.775
+0.59
1.73%
jan 1, 2007
35.386
+0.611
1.76%
jan 1, 2008
36.017
+0.631
1.78%
jan 1, 2009
36.666
+0.648
1.8%
jan 1, 2010
37.338
+0.672
1.83%
jan 1, 2011
38.008
+0.67
1.8%
jan 1, 2012
38.686
+0.678
1.78%
jan 1, 2013
39.373
+0.687
1.78%
jan 1, 2014
40.069
+0.696
1.77%
jan 1, 2015
40.775
+0.706
1.76%
jan 1, 2016
41.491
+0.716
1.76%
Ranking of countries by current statistics by years


Comments: