29
/
en
AIzaSyAYiBZKx7MnpbEhh9jyipgxe19OcubqV5w
April 1, 2024
52957
OECD members
OED
false
2
1
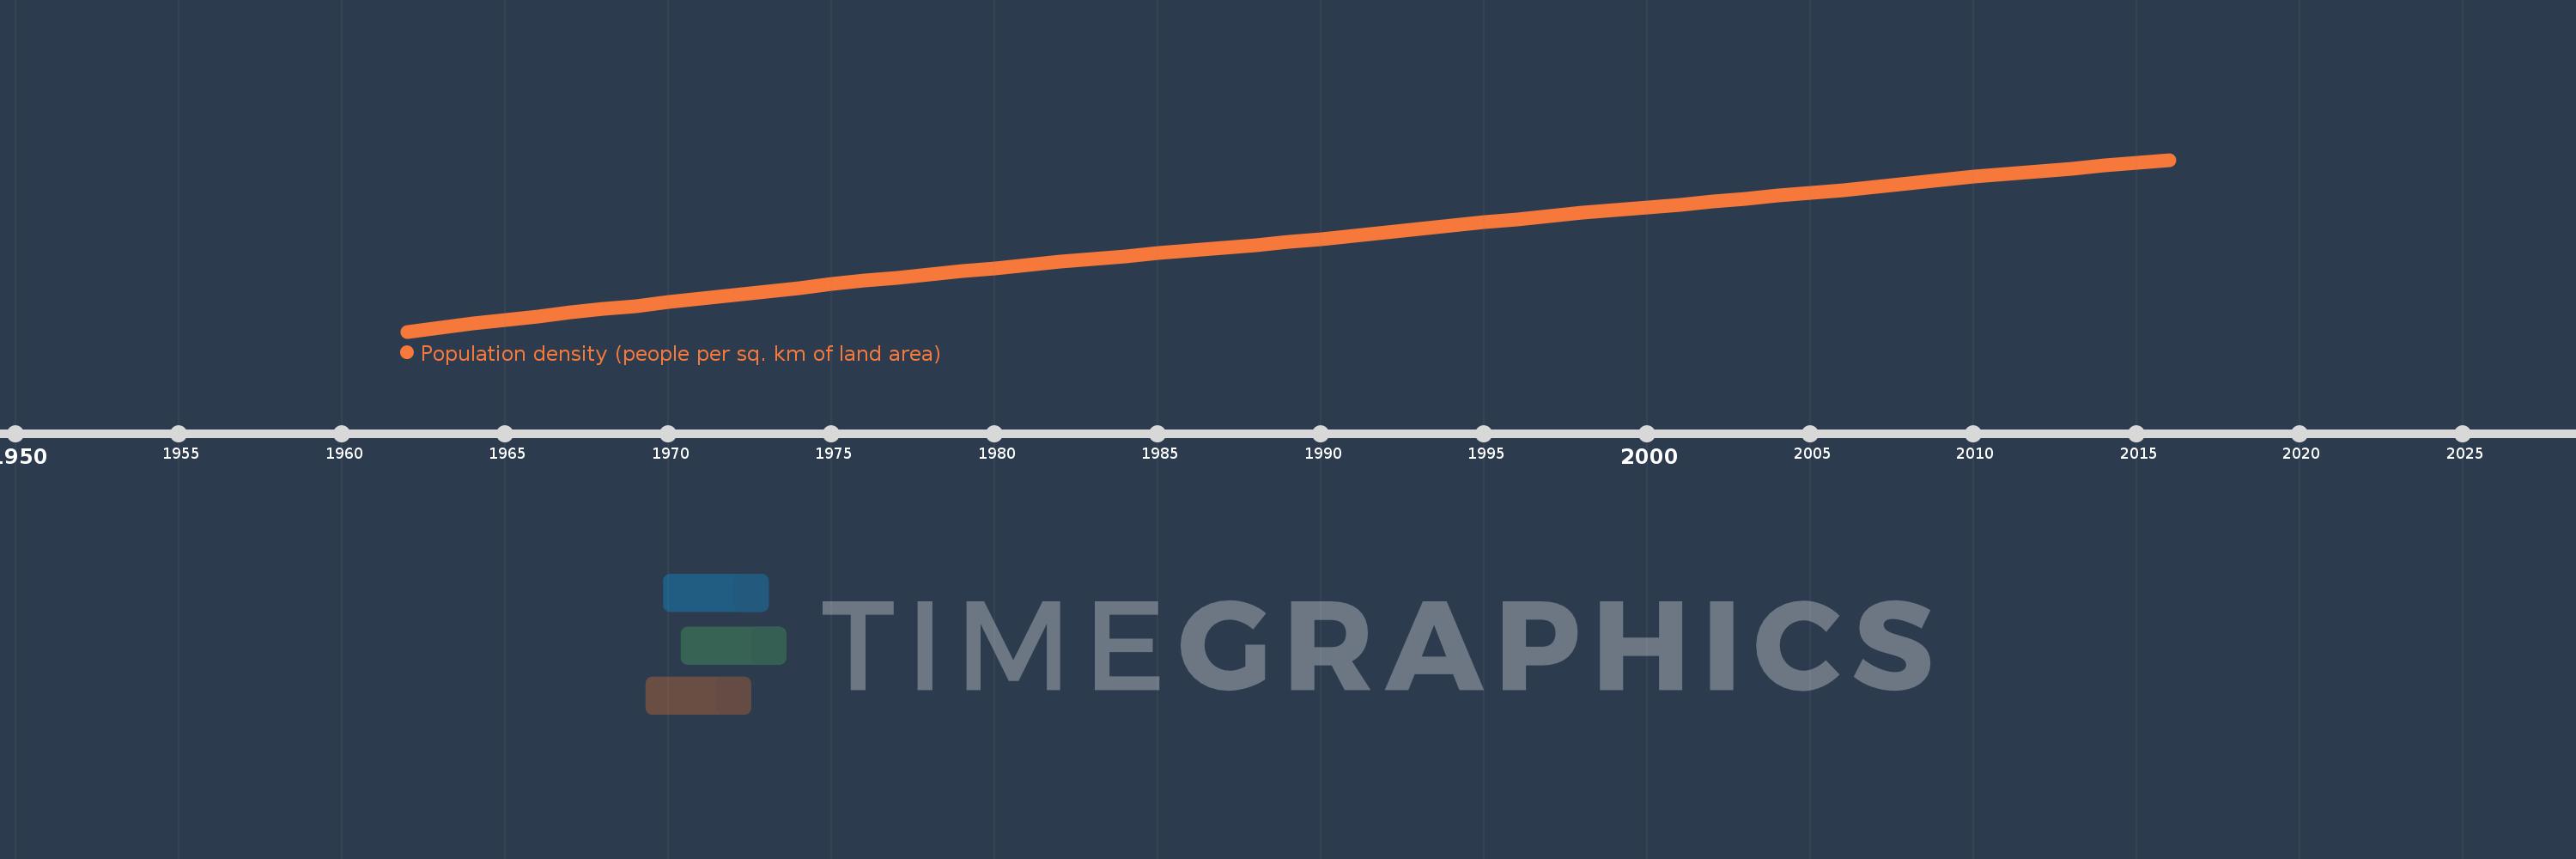
Population density (people per sq. km of land area)
2016,2015,2014,2013,2012,2011,2010,2009,2008,2007,2006,2005,2004,2003,2002,2001,2000,1999,1998,1997,1996,1995,1994,1993,1992,1991,1990,1989,1988,1987,1986,1985,1984,1983,1982,1981,1980,1979,1978,1977,1976,1975,1974,1973,1972,1971,1970,1969,1968,1967,1966,1965,1964,1963,1962
This statistics in other country:
AfghanistanAlbaniaAlgeriaAmerican SamoaAndorraAngolaAntigua and BarbudaArab WorldArgentinaArmeniaArubaAustraliaAustriaAzerbaijanBahamas, TheBahrainBangladeshBarbadosBelarusBelgiumBelizeBeninBermudaBhutanBoliviaBosnia and HerzegovinaBotswanaBrazilBritish Virgin IslandsBrunei DarussalamBulgariaBurkina FasoBurundiCabo VerdeCambodiaCameroonCanadaCaribbean small statesCayman IslandsCentral African RepublicCentral Europe and the BalticsChadChannel IslandsChileChinaColombiaComorosCongo, Dem. Rep.Congo, Rep.Costa RicaCote d'IvoireCroatiaCubaCuracaoCyprusCzech RepublicDenmarkDjiboutiDominicaDominican RepublicEarly-demographic dividendEast Asia & PacificEast Asia & Pacific (excluding high income)East Asia & Pacific (IDA & IBRD countries)EcuadorEgypt, Arab Rep.El SalvadorEquatorial GuineaEritreaEstoniaEthiopiaEuro areaEurope & Central AsiaEurope & Central Asia (excluding high income)Europe & Central Asia (IDA & IBRD countries)European UnionFaroe IslandsFijiFinlandFragile and conflict affected situationsFranceFrench PolynesiaGabonGambia, TheGeorgiaGermanyGhanaGibraltarGreeceGreenlandGrenadaGuamGuatemalaGuineaGuinea-BissauGuyanaHaitiHeavily indebted poor countries (HIPC)High incomeHondurasHong Kong SAR, ChinaHungaryIBRD onlyIcelandIDA & IBRD totalIDA blendIDA onlyIDA totalIndiaIndonesiaIran, Islamic Rep.IraqIrelandIsle of ManIsraelItalyJamaicaJapanJordanKazakhstanKenyaKiribatiKorea, Dem. People’s Rep.Korea, Rep.KosovoKuwaitKyrgyz RepublicLao PDRLate-demographic dividendLatin America & Caribbean Latin America & Caribbean (excluding high income)Latin America & the Caribbean (IDA & IBRD countries)LatviaLeast developed countries: UN classificationLebanonLesothoLiberiaLibyaLiechtensteinLithuaniaLow & middle incomeLow incomeLower middle incomeLuxembourgMacao SAR, ChinaMacedonia, FYRMadagascarMalawiMalaysiaMaldivesMaliMaltaMarshall IslandsMauritaniaMauritiusMexicoMicronesia, Fed. Sts.Middle East & North AfricaMiddle East & North Africa (excluding high income)Middle East & North Africa (IDA & IBRD countries)Middle incomeMoldovaMonacoMongoliaMontenegroMoroccoMozambiqueMyanmarNamibiaNauruNepalNetherlandsNew CaledoniaNew ZealandNicaraguaNigerNigeriaNorth AmericaNorthern Mariana IslandsNorwayOECD membersOmanOther small statesPacific island small statesPakistanPalauPanamaPapua New GuineaParaguayPeruPhilippinesPolandPortugalPost-demographic dividendPre-demographic dividendPuerto RicoQatarRomaniaRussian FederationRwandaSamoaSan MarinoSao Tome and PrincipeSaudi ArabiaSenegalSerbiaSeychellesSierra LeoneSingaporeSint Maarten (Dutch part)Slovak RepublicSloveniaSmall statesSolomon IslandsSomaliaSouth AfricaSouth AsiaSouth Asia (IDA & IBRD)SpainSri LankaSt. Kitts and NevisSt. LuciaSt. Martin (French part)St. Vincent and the GrenadinesSub-Saharan Africa Sub-Saharan Africa (excluding high income)Sub-Saharan Africa (IDA & IBRD countries)SudanSurinameSwazilandSwedenSwitzerlandSyrian Arab RepublicTajikistanTanzaniaThailandTimor-LesteTogoTongaTrinidad and TobagoTunisiaTurkeyTurkmenistanTurks and Caicos IslandsTuvaluUgandaUkraineUnited Arab EmiratesUnited KingdomUnited StatesUpper middle incomeUruguayUzbekistanVanuatuVenezuela, RBVietnamVirgin Islands (U.S.)West Bank and GazaWorldYemen, Rep.ZambiaZimbabwe Timeline:
This timeline shows a graph from 1962 to 2016 of OECD members. No data until 1961. Number of actual observations by date: 55.
Source name:
World Development Indicators
Source organization:
Food and Agriculture Organization and World Bank population estimates.
Categories, topics:
Urban Development
Last updated:
apr 23, 2017
Indicators value changes by year
Minimum:
23.296
jan 1, 1962
At the date of observation
Value
Absolute change
Change from previous value
jan 1, 1962
23.296
+23.296
0.0%
jan 1, 1963
23.615
+0.318
1.37%
jan 1, 1964
23.932
+0.317
1.34%
jan 1, 1965
24.248
+0.316
1.32%
jan 1, 1966
24.555
+0.306
1.26%
jan 1, 1967
24.846
+0.291
1.19%
jan 1, 1968
25.125
+0.279
1.12%
jan 1, 1969
25.378
+0.253
1.01%
jan 1, 1970
25.683
+0.305
1.2%
jan 1, 1971
25.962
+0.278
1.08%
jan 1, 1972
26.26
+0.299
1.15%
jan 1, 1973
26.566
+0.306
1.16%
jan 1, 1974
26.846
+0.28
1.05%
jan 1, 1975
27.156
+0.311
1.16%
jan 1, 1976
27.451
+0.295
1.09%
jan 1, 1977
27.702
+0.251
0.91%
jan 1, 1978
27.957
+0.255
0.92%
jan 1, 1979
28.213
+0.255
0.91%
jan 1, 1980
28.471
+0.259
0.92%
jan 1, 1981
28.727
+0.255
0.9%
jan 1, 1982
28.979
+0.252
0.88%
jan 1, 1983
29.219
+0.24
0.83%
jan 1, 1984
29.448
+0.229
0.79%
jan 1, 1985
29.669
+0.221
0.75%
jan 1, 1986
29.891
+0.222
0.75%
jan 1, 1987
30.122
+0.231
0.77%
jan 1, 1988
30.352
+0.23
0.76%
jan 1, 1989
30.586
+0.234
0.77%
jan 1, 1990
30.834
+0.249
0.81%
jan 1, 1991
31.099
+0.265
0.86%
jan 1, 1992
31.381
+0.282
0.91%
jan 1, 1993
31.667
+0.286
0.91%
jan 1, 1994
31.94
+0.273
0.86%
jan 1, 1995
32.199
+0.259
0.81%
jan 1, 1996
32.454
+0.255
0.79%
jan 1, 1997
32.704
+0.25
0.77%
jan 1, 1998
32.953
+0.249
0.76%
jan 1, 1999
33.193
+0.24
0.73%
jan 1, 2000
33.433
+0.239
0.72%
jan 1, 2001
33.631
+0.199
0.59%
jan 1, 2002
33.872
+0.241
0.72%
jan 1, 2003
34.113
+0.241
0.71%
jan 1, 2004
34.354
+0.241
0.71%
jan 1, 2005
34.597
+0.243
0.71%
jan 1, 2006
34.841
+0.244
0.71%
jan 1, 2007
35.095
+0.255
0.73%
jan 1, 2008
35.358
+0.263
0.75%
jan 1, 2009
35.65
+0.292
0.83%
jan 1, 2010
35.905
+0.255
0.71%
jan 1, 2011
36.143
+0.238
0.66%
jan 1, 2012
36.333
+0.19
0.53%
jan 1, 2013
36.567
+0.234
0.64%
jan 1, 2014
36.808
+0.24
0.66%
jan 1, 2015
37.053
+0.245
0.67%
jan 1, 2016
37.29
+0.237
0.64%
Ranking of countries by current statistics by years


Comments: