29
/
en
AIzaSyAYiBZKx7MnpbEhh9jyipgxe19OcubqV5w
April 1, 2024
263892
Timor-Leste
TLS
true
2
1
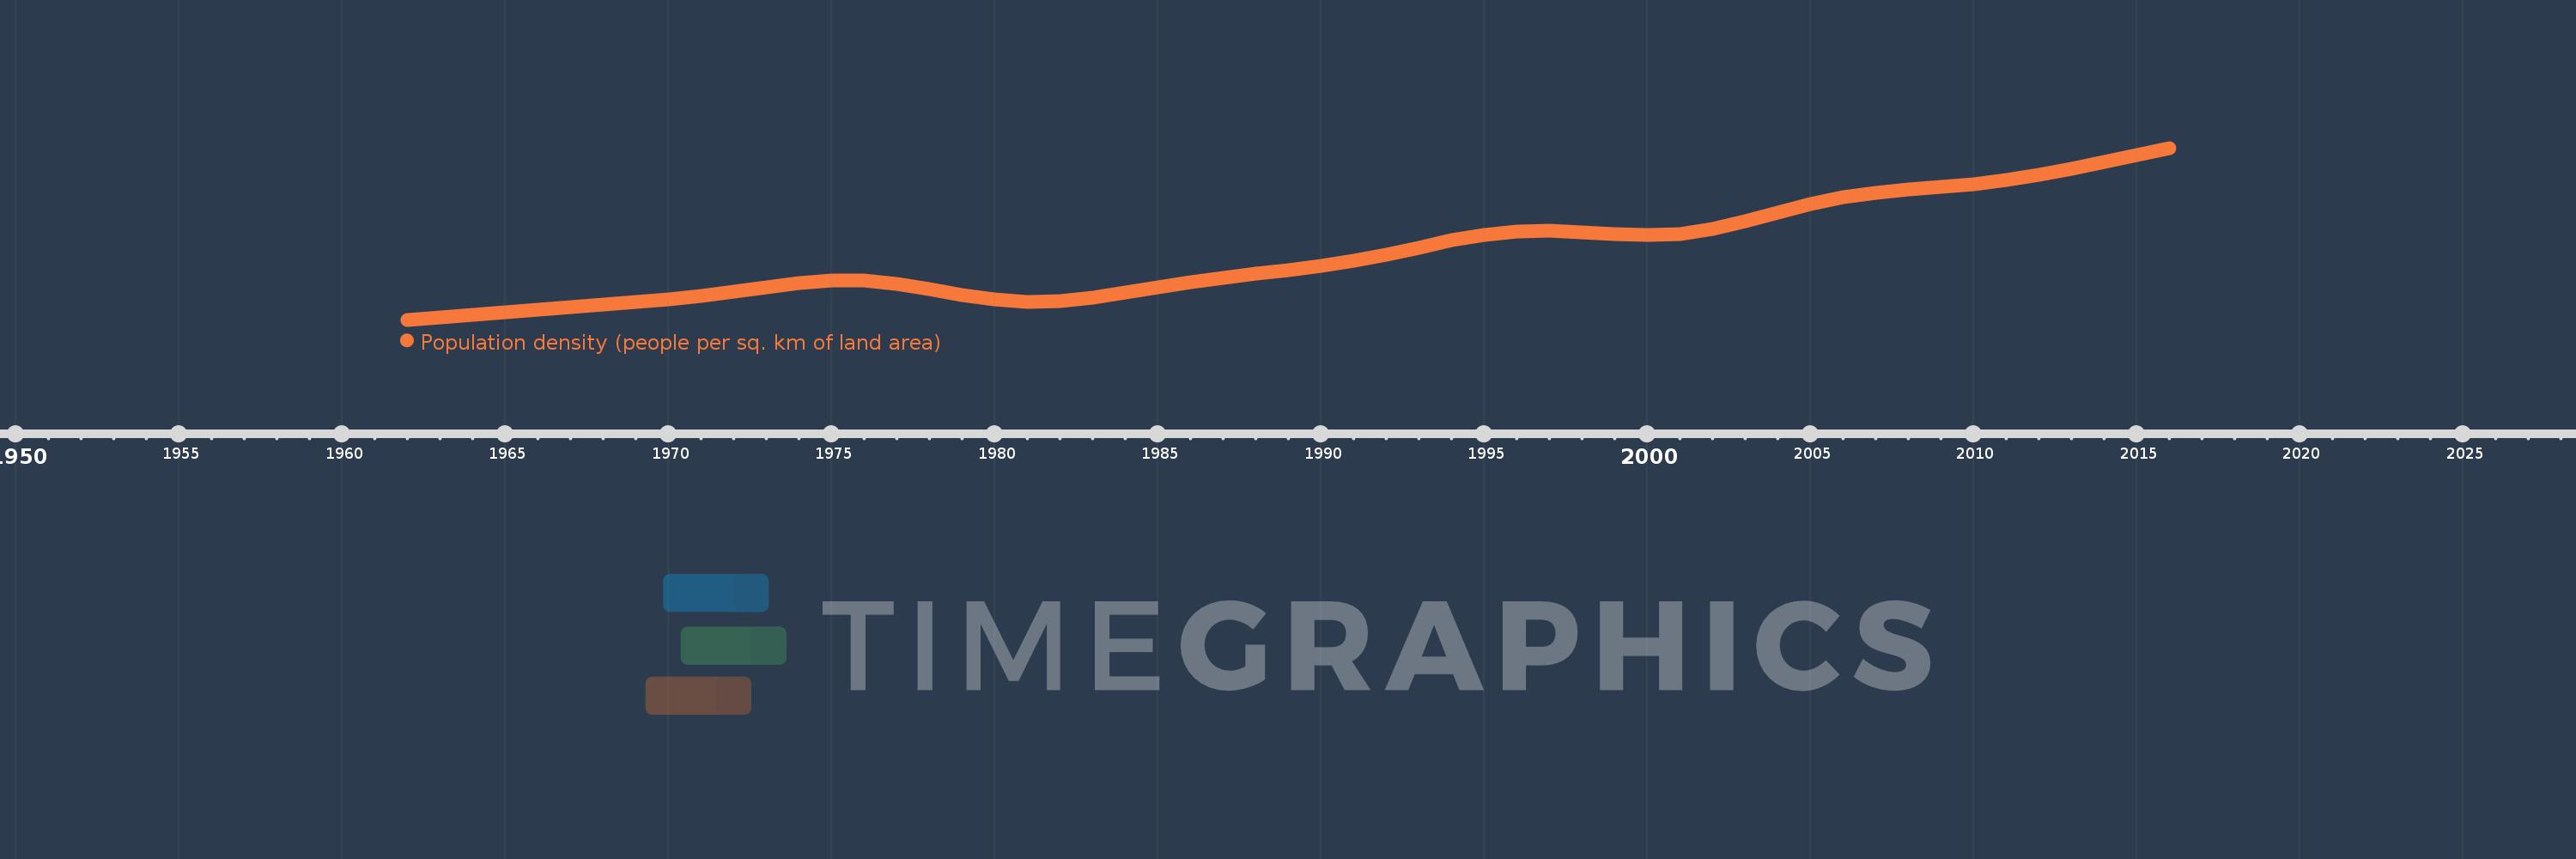
Population density (people per sq. km of land area)
2016,2015,2014,2013,2012,2011,2010,2009,2008,2007,2006,2005,2004,2003,2002,2001,2000,1999,1998,1997,1996,1995,1994,1993,1992,1991,1990,1989,1988,1987,1986,1985,1984,1983,1982,1981,1980,1979,1978,1977,1976,1975,1974,1973,1972,1971,1970,1969,1968,1967,1966,1965,1964,1963,1962
This statistics in other country:
AfghanistanAlbaniaAlgeriaAmerican SamoaAndorraAngolaAntigua and BarbudaArab WorldArgentinaArmeniaArubaAustraliaAustriaAzerbaijanBahamas, TheBahrainBangladeshBarbadosBelarusBelgiumBelizeBeninBermudaBhutanBoliviaBosnia and HerzegovinaBotswanaBrazilBritish Virgin IslandsBrunei DarussalamBulgariaBurkina FasoBurundiCabo VerdeCambodiaCameroonCanadaCaribbean small statesCayman IslandsCentral African RepublicCentral Europe and the BalticsChadChannel IslandsChileChinaColombiaComorosCongo, Dem. Rep.Congo, Rep.Costa RicaCote d'IvoireCroatiaCubaCuracaoCyprusCzech RepublicDenmarkDjiboutiDominicaDominican RepublicEarly-demographic dividendEast Asia & PacificEast Asia & Pacific (excluding high income)East Asia & Pacific (IDA & IBRD countries)EcuadorEgypt, Arab Rep.El SalvadorEquatorial GuineaEritreaEstoniaEthiopiaEuro areaEurope & Central AsiaEurope & Central Asia (excluding high income)Europe & Central Asia (IDA & IBRD countries)European UnionFaroe IslandsFijiFinlandFragile and conflict affected situationsFranceFrench PolynesiaGabonGambia, TheGeorgiaGermanyGhanaGibraltarGreeceGreenlandGrenadaGuamGuatemalaGuineaGuinea-BissauGuyanaHaitiHeavily indebted poor countries (HIPC)High incomeHondurasHong Kong SAR, ChinaHungaryIBRD onlyIcelandIDA & IBRD totalIDA blendIDA onlyIDA totalIndiaIndonesiaIran, Islamic Rep.IraqIrelandIsle of ManIsraelItalyJamaicaJapanJordanKazakhstanKenyaKiribatiKorea, Dem. People’s Rep.Korea, Rep.KosovoKuwaitKyrgyz RepublicLao PDRLate-demographic dividendLatin America & Caribbean Latin America & Caribbean (excluding high income)Latin America & the Caribbean (IDA & IBRD countries)LatviaLeast developed countries: UN classificationLebanonLesothoLiberiaLibyaLiechtensteinLithuaniaLow & middle incomeLow incomeLower middle incomeLuxembourgMacao SAR, ChinaMacedonia, FYRMadagascarMalawiMalaysiaMaldivesMaliMaltaMarshall IslandsMauritaniaMauritiusMexicoMicronesia, Fed. Sts.Middle East & North AfricaMiddle East & North Africa (excluding high income)Middle East & North Africa (IDA & IBRD countries)Middle incomeMoldovaMonacoMongoliaMontenegroMoroccoMozambiqueMyanmarNamibiaNauruNepalNetherlandsNew CaledoniaNew ZealandNicaraguaNigerNigeriaNorth AmericaNorthern Mariana IslandsNorwayOECD membersOmanOther small statesPacific island small statesPakistanPalauPanamaPapua New GuineaParaguayPeruPhilippinesPolandPortugalPost-demographic dividendPre-demographic dividendPuerto RicoQatarRomaniaRussian FederationRwandaSamoaSan MarinoSao Tome and PrincipeSaudi ArabiaSenegalSerbiaSeychellesSierra LeoneSingaporeSint Maarten (Dutch part)Slovak RepublicSloveniaSmall statesSolomon IslandsSomaliaSouth AfricaSouth AsiaSouth Asia (IDA & IBRD)SpainSri LankaSt. Kitts and NevisSt. LuciaSt. Martin (French part)St. Vincent and the GrenadinesSub-Saharan Africa Sub-Saharan Africa (excluding high income)Sub-Saharan Africa (IDA & IBRD countries)SudanSurinameSwazilandSwedenSwitzerlandSyrian Arab RepublicTajikistanTanzaniaThailandTimor-LesteTogoTongaTrinidad and TobagoTunisiaTurkeyTurkmenistanTurks and Caicos IslandsTuvaluUgandaUkraineUnited Arab EmiratesUnited KingdomUnited StatesUpper middle incomeUruguayUzbekistanVanuatuVenezuela, RBVietnamVirgin Islands (U.S.)West Bank and GazaWorldYemen, Rep.ZambiaZimbabwe Timeline:
This timeline shows a graph from 1962 to 2016 of Timor-Leste. No data until 1961. Number of actual observations by date: 55.
Source name:
World Development Indicators
Source organization:
Food and Agriculture Organization and World Bank population estimates.
Categories, topics:
Urban Development
Last updated:
apr 23, 2017
Indicators value changes by year
Minimum:
34.184
jan 1, 1962
Maximum:
79.675
jan 1, 2016
At the date of observation
Value
Absolute change
Change from previous value
jan 1, 1962
34.184
+34.184
0.0%
jan 1, 1963
34.798
+0.614
1.8%
jan 1, 1964
35.436
+0.638
1.83%
jan 1, 1965
36.099
+0.663
1.87%
jan 1, 1966
36.788
+0.688
1.91%
jan 1, 1967
37.475
+0.687
1.87%
jan 1, 1968
38.153
+0.678
1.81%
jan 1, 1969
38.858
+0.706
1.85%
jan 1, 1970
39.645
+0.786
2.02%
jan 1, 1971
40.534
+0.889
2.24%
jan 1, 1972
41.594
+1.061
2.62%
jan 1, 1973
42.777
+1.183
2.84%
jan 1, 1974
43.848
+1.07
2.5%
jan 1, 1975
44.487
+0.64
1.46%
jan 1, 1976
44.495
+0.007
0.02%
jan 1, 1977
43.745
-0.749
-1.68%
jan 1, 1978
42.377
-1.368
-3.13%
jan 1, 1979
40.773
-1.604
-3.79%
jan 1, 1980
39.468
-1.305
-3.2%
jan 1, 1981
38.842
-0.626
-1.59%
jan 1, 1982
39.042
+0.2
0.52%
jan 1, 1983
39.942
+0.9
2.3%
jan 1, 1984
41.317
+1.375
3.44%
jan 1, 1985
42.816
+1.499
3.63%
jan 1, 1986
44.184
+1.368
3.2%
jan 1, 1987
45.335
+1.151
2.6%
jan 1, 1988
46.346
+1.012
2.23%
jan 1, 1989
47.323
+0.977
2.11%
jan 1, 1990
48.433
+1.11
2.35%
jan 1, 1991
49.78
+1.347
2.78%
jan 1, 1992
51.438
+1.658
3.33%
jan 1, 1993
53.318
+1.88
3.66%
jan 1, 1994
55.176
+1.858
3.48%
jan 1, 1995
56.675
+1.498
2.72%
jan 1, 1996
57.595
+0.92
1.62%
jan 1, 1997
57.801
+0.206
0.36%
jan 1, 1998
57.422
-0.379
-0.65%
jan 1, 1999
56.833
-0.589
-1.03%
jan 1, 2000
56.561
-0.272
-0.48%
jan 1, 2001
56.973
+0.412
0.73%
jan 1, 2002
58.228
+1.255
2.2%
jan 1, 2003
60.177
+1.949
3.35%
jan 1, 2004
62.504
+2.326
3.87%
jan 1, 2005
64.737
+2.233
3.57%
jan 1, 2006
66.543
+1.807
2.79%
jan 1, 2007
67.814
+1.27
1.91%
jan 1, 2008
68.678
+0.864
1.27%
jan 1, 2009
69.329
+0.651
0.95%
jan 1, 2010
70.062
+0.734
1.06%
jan 1, 2011
71.091
+1.029
1.47%
jan 1, 2012
72.468
+1.377
1.94%
jan 1, 2013
74.114
+1.646
2.27%
jan 1, 2014
75.946
+1.832
2.47%
jan 1, 2015
77.832
+1.886
2.48%
jan 1, 2016
79.675
+1.843
2.37%
Ranking of countries by current statistics by years


Comments: