29
/
en
AIzaSyAYiBZKx7MnpbEhh9jyipgxe19OcubqV5w
April 1, 2024
98902
Cambodia
KHM
true
2
1
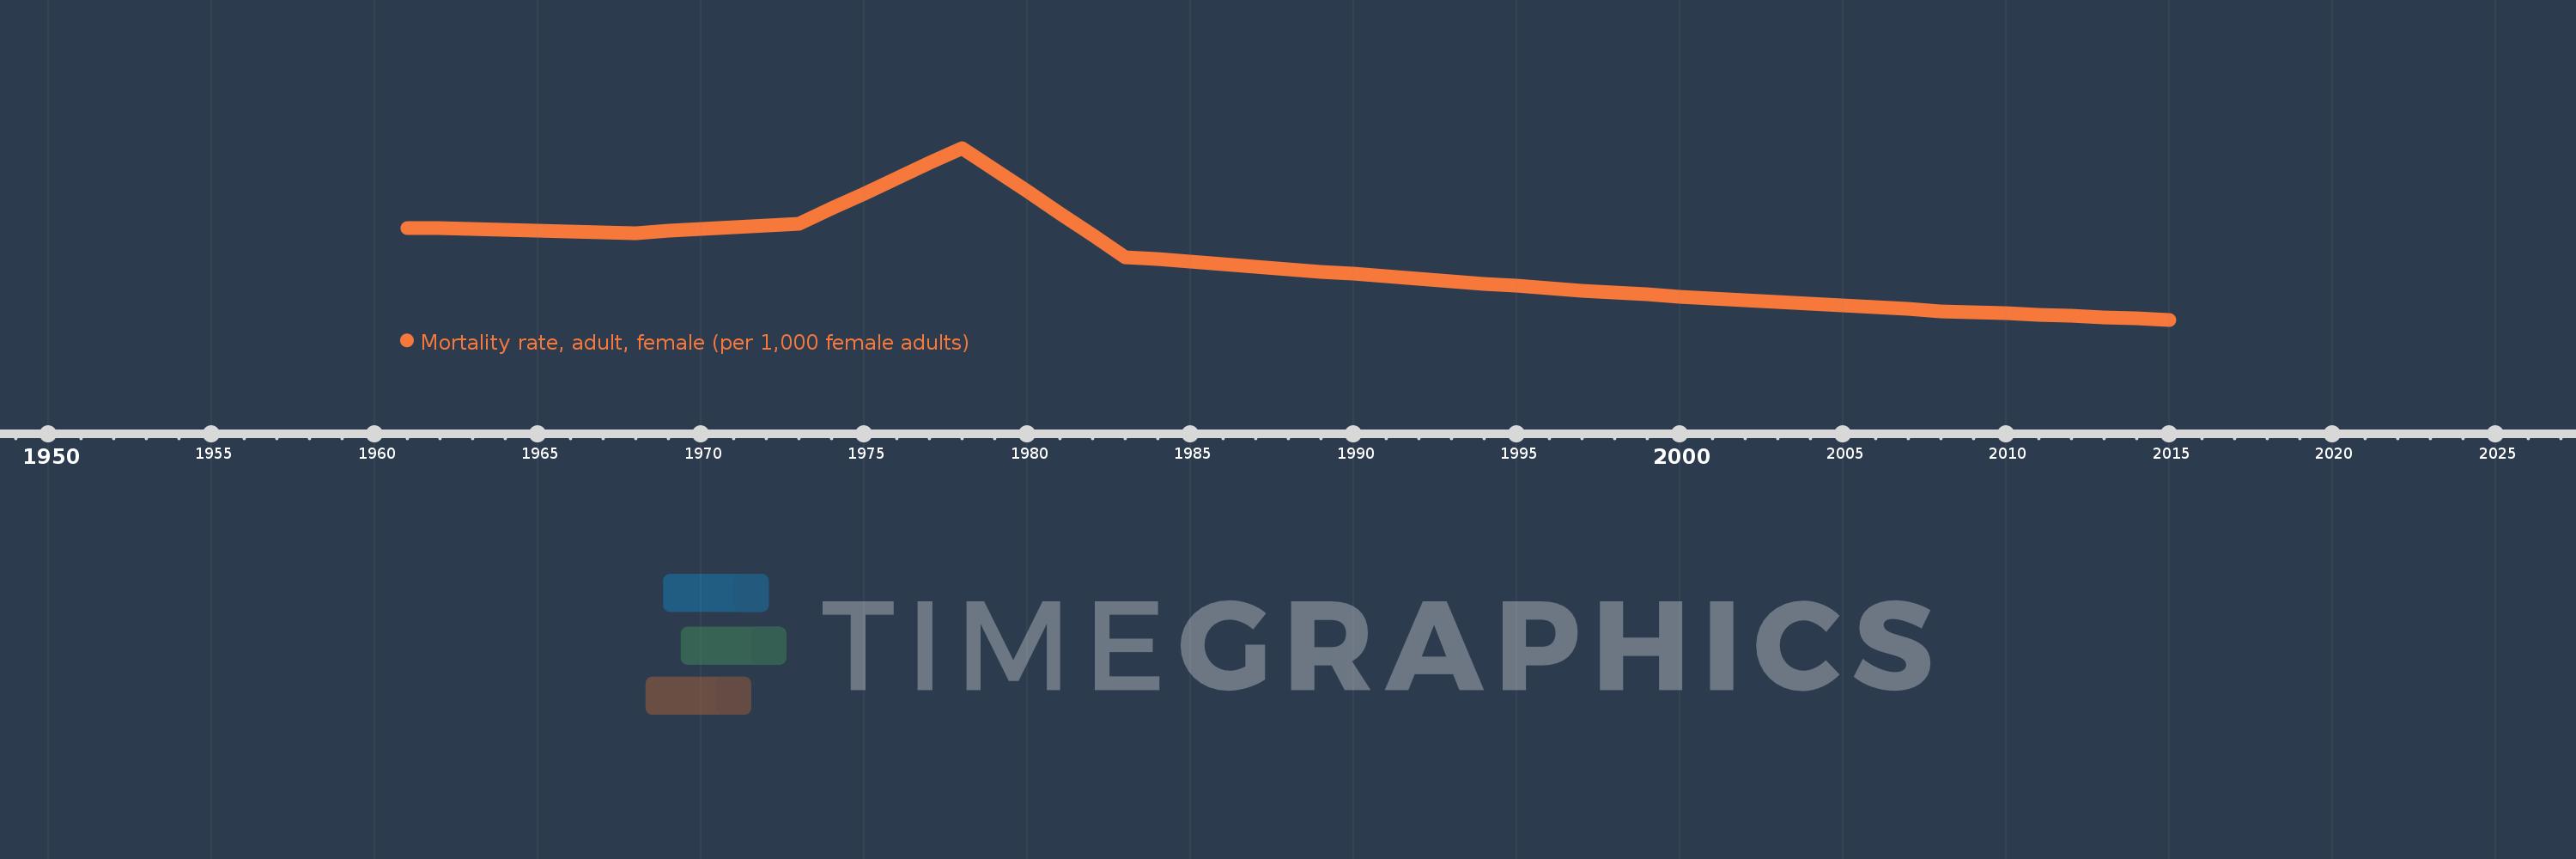
Mortality rate, adult, female (per 1,000 female adults)
2015,2014,2013,2012,2011,2010,2009,2008,2007,2006,2005,2004,2003,2002,2001,2000,1999,1998,1997,1996,1995,1994,1993,1992,1991,1990,1989,1988,1987,1986,1985,1984,1983,1982,1981,1980,1979,1978,1977,1976,1975,1974,1973,1972,1971,1970,1969,1968,1967,1966,1965,1964,1963,1962,1961
This statistics in other country:
AfghanistanAlbaniaAlgeriaAngolaAntigua and BarbudaArab WorldArgentinaArmeniaArubaAustraliaAustriaAzerbaijanBahamas, TheBahrainBangladeshBarbadosBelarusBelgiumBelizeBeninBhutanBoliviaBosnia and HerzegovinaBotswanaBrazilBrunei DarussalamBulgariaBurkina FasoBurundiCabo VerdeCambodiaCameroonCanadaCaribbean small statesCentral African RepublicCentral Europe and the BalticsChadChannel IslandsChileChinaColombiaComorosCongo, Dem. Rep.Congo, Rep.Costa RicaCote d'IvoireCroatiaCubaCuracaoCyprusCzech RepublicDenmarkDjiboutiDominicaDominican RepublicEarly-demographic dividendEast Asia & PacificEast Asia & Pacific (excluding high income)East Asia & Pacific (IDA & IBRD countries)EcuadorEgypt, Arab Rep.El SalvadorEquatorial GuineaEritreaEstoniaEthiopiaEuro areaEurope & Central AsiaEurope & Central Asia (excluding high income)Europe & Central Asia (IDA & IBRD countries)European UnionFijiFinlandFragile and conflict affected situationsFranceFrench PolynesiaGabonGambia, TheGeorgiaGermanyGhanaGreeceGreenlandGrenadaGuamGuatemalaGuineaGuinea-BissauGuyanaHaitiHeavily indebted poor countries (HIPC)High incomeHondurasHong Kong SAR, ChinaHungaryIBRD onlyIcelandIDA & IBRD totalIDA blendIDA onlyIDA totalIndiaIndonesiaIran, Islamic Rep.IraqIrelandIsraelItalyJamaicaJapanJordanKazakhstanKenyaKiribatiKorea, Dem. People’s Rep.Korea, Rep.KuwaitKyrgyz RepublicLao PDRLate-demographic dividendLatin America & Caribbean Latin America & Caribbean (excluding high income)Latin America & the Caribbean (IDA & IBRD countries)LatviaLeast developed countries: UN classificationLebanonLesothoLiberiaLibyaLithuaniaLow & middle incomeLow incomeLower middle incomeLuxembourgMacao SAR, ChinaMacedonia, FYRMadagascarMalawiMalaysiaMaldivesMaliMaltaMarshall IslandsMauritaniaMauritiusMexicoMicronesia, Fed. Sts.Middle East & North AfricaMiddle East & North Africa (excluding high income)Middle East & North Africa (IDA & IBRD countries)Middle incomeMoldovaMongoliaMontenegroMoroccoMozambiqueMyanmarNamibiaNepalNetherlandsNew CaledoniaNew ZealandNicaraguaNigerNigeriaNorth AmericaNorwayOECD membersOmanOther small statesPacific island small statesPakistanPanamaPapua New GuineaParaguayPeruPhilippinesPolandPortugalPost-demographic dividendPre-demographic dividendPuerto RicoQatarRomaniaRussian FederationRwandaSamoaSao Tome and PrincipeSaudi ArabiaSenegalSerbiaSeychellesSierra LeoneSingaporeSlovak RepublicSloveniaSmall statesSolomon IslandsSomaliaSouth AfricaSouth AsiaSouth Asia (IDA & IBRD)South SudanSpainSri LankaSt. Kitts and NevisSt. LuciaSt. Vincent and the GrenadinesSub-Saharan Africa Sub-Saharan Africa (excluding high income)Sub-Saharan Africa (IDA & IBRD countries)SudanSurinameSwazilandSwedenSwitzerlandSyrian Arab RepublicTajikistanTanzaniaThailandTimor-LesteTogoTongaTrinidad and TobagoTunisiaTurkeyTurkmenistanUgandaUkraineUnited Arab EmiratesUnited KingdomUnited StatesUpper middle incomeUruguayUzbekistanVanuatuVenezuela, RBVietnamVirgin Islands (U.S.)West Bank and GazaWorldYemen, Rep.ZambiaZimbabwe Timeline:
This timeline shows a graph from 1961 to 2015 of Cambodia. No data until 1960. Number of actual observations by date: 55.
Source name:
World Development Indicators
Source organization:
(1) United Nations Population Division. World Population Prospects. New York, United Nations, Department of Economic and Social Affairs (advanced Excel tables). Available at http://esa.un.org/wpp/unpp/panel_population.htm, (2) University of California, Berkeley, and Max Planck Institute for Demographic Research. Human Mortality Database. [ www.mortality.org or www.humanmortality.de].
Categories, topics:
Health, Gender
Last updated:
apr 23, 2017
Indicators value changes by year
Minimum:
145.178
jan 1, 2015
Maximum:
796.056
jan 1, 1978
At the date of observation
Value
Absolute change
Change from previous value
jan 1, 1961
493.7
+493.7
0.0%
jan 1, 1962
491.405
-2.295
-0.46%
jan 1, 1963
489.11
-2.295
-0.47%
jan 1, 1964
486.116
-2.994
-0.61%
jan 1, 1965
483.123
-2.993
-0.62%
jan 1, 1966
480.129
-2.994
-0.62%
jan 1, 1967
477.135
-2.994
-0.62%
jan 1, 1968
474.141
-2.994
-0.63%
jan 1, 1969
481.172
+7.031
1.48%
jan 1, 1970
488.202
+7.03
1.46%
jan 1, 1971
495.232
+7.03
1.44%
jan 1, 1972
502.263
+7.031
1.42%
jan 1, 1973
509.293
+7.03
1.4%
jan 1, 1974
566.646
+57.353
11.26%
jan 1, 1975
623.998
+57.352
10.12%
jan 1, 1976
681.351
+57.353
9.19%
jan 1, 1977
738.704
+57.353
8.42%
jan 1, 1978
796.056
+57.352
7.76%
jan 1, 1979
713.42
-82.636
-10.38%
jan 1, 1980
630.784
-82.636
-11.58%
jan 1, 1981
548.147
-82.637
-13.1%
jan 1, 1982
465.511
-82.636
-15.08%
jan 1, 1983
382.875
-82.636
-17.75%
jan 1, 1984
373.758
-9.117
-2.38%
jan 1, 1985
364.641
-9.117
-2.44%
jan 1, 1986
355.524
-9.117
-2.5%
jan 1, 1987
346.407
-9.117
-2.56%
jan 1, 1988
337.29
-9.117
-2.63%
jan 1, 1989
327.956
-9.334
-2.77%
jan 1, 1990
318.622
-9.334
-2.85%
jan 1, 1991
309.288
-9.334
-2.93%
jan 1, 1992
299.953
-9.335
-3.02%
jan 1, 1993
290.619
-9.334
-3.11%
jan 1, 1994
281.912
-8.707
-3.0%
jan 1, 1995
273.204
-8.708
-3.09%
jan 1, 1996
264.497
-8.707
-3.19%
jan 1, 1997
255.789
-8.708
-3.29%
jan 1, 1998
247.082
-8.707
-3.4%
jan 1, 1999
240.298
-6.784
-2.75%
jan 1, 2000
233.514
-6.784
-2.82%
jan 1, 2001
226.73
-6.784
-2.91%
jan 1, 2002
219.946
-6.784
-2.99%
jan 1, 2003
213.162
-6.784
-3.08%
jan 1, 2004
206.19
-6.972
-3.27%
jan 1, 2005
199.218
-6.972
-3.38%
jan 1, 2006
192.245
-6.973
-3.5%
jan 1, 2007
185.273
-6.972
-3.63%
jan 1, 2008
178.301
-6.972
-3.76%
jan 1, 2009
173.697
-4.604
-2.58%
jan 1, 2010
169.093
-4.604
-2.65%
jan 1, 2011
164.488
-4.605
-2.72%
jan 1, 2012
159.884
-4.604
-2.8%
jan 1, 2013
155.28
-4.604
-2.88%
jan 1, 2014
150.229
-5.051
-3.25%
jan 1, 2015
145.178
-5.051
-3.36%
Ranking of countries by current statistics by years


Comments: