29
/
en
AIzaSyAYiBZKx7MnpbEhh9jyipgxe19OcubqV5w
April 1, 2024
282598
Vietnam
VNM
true
2
1
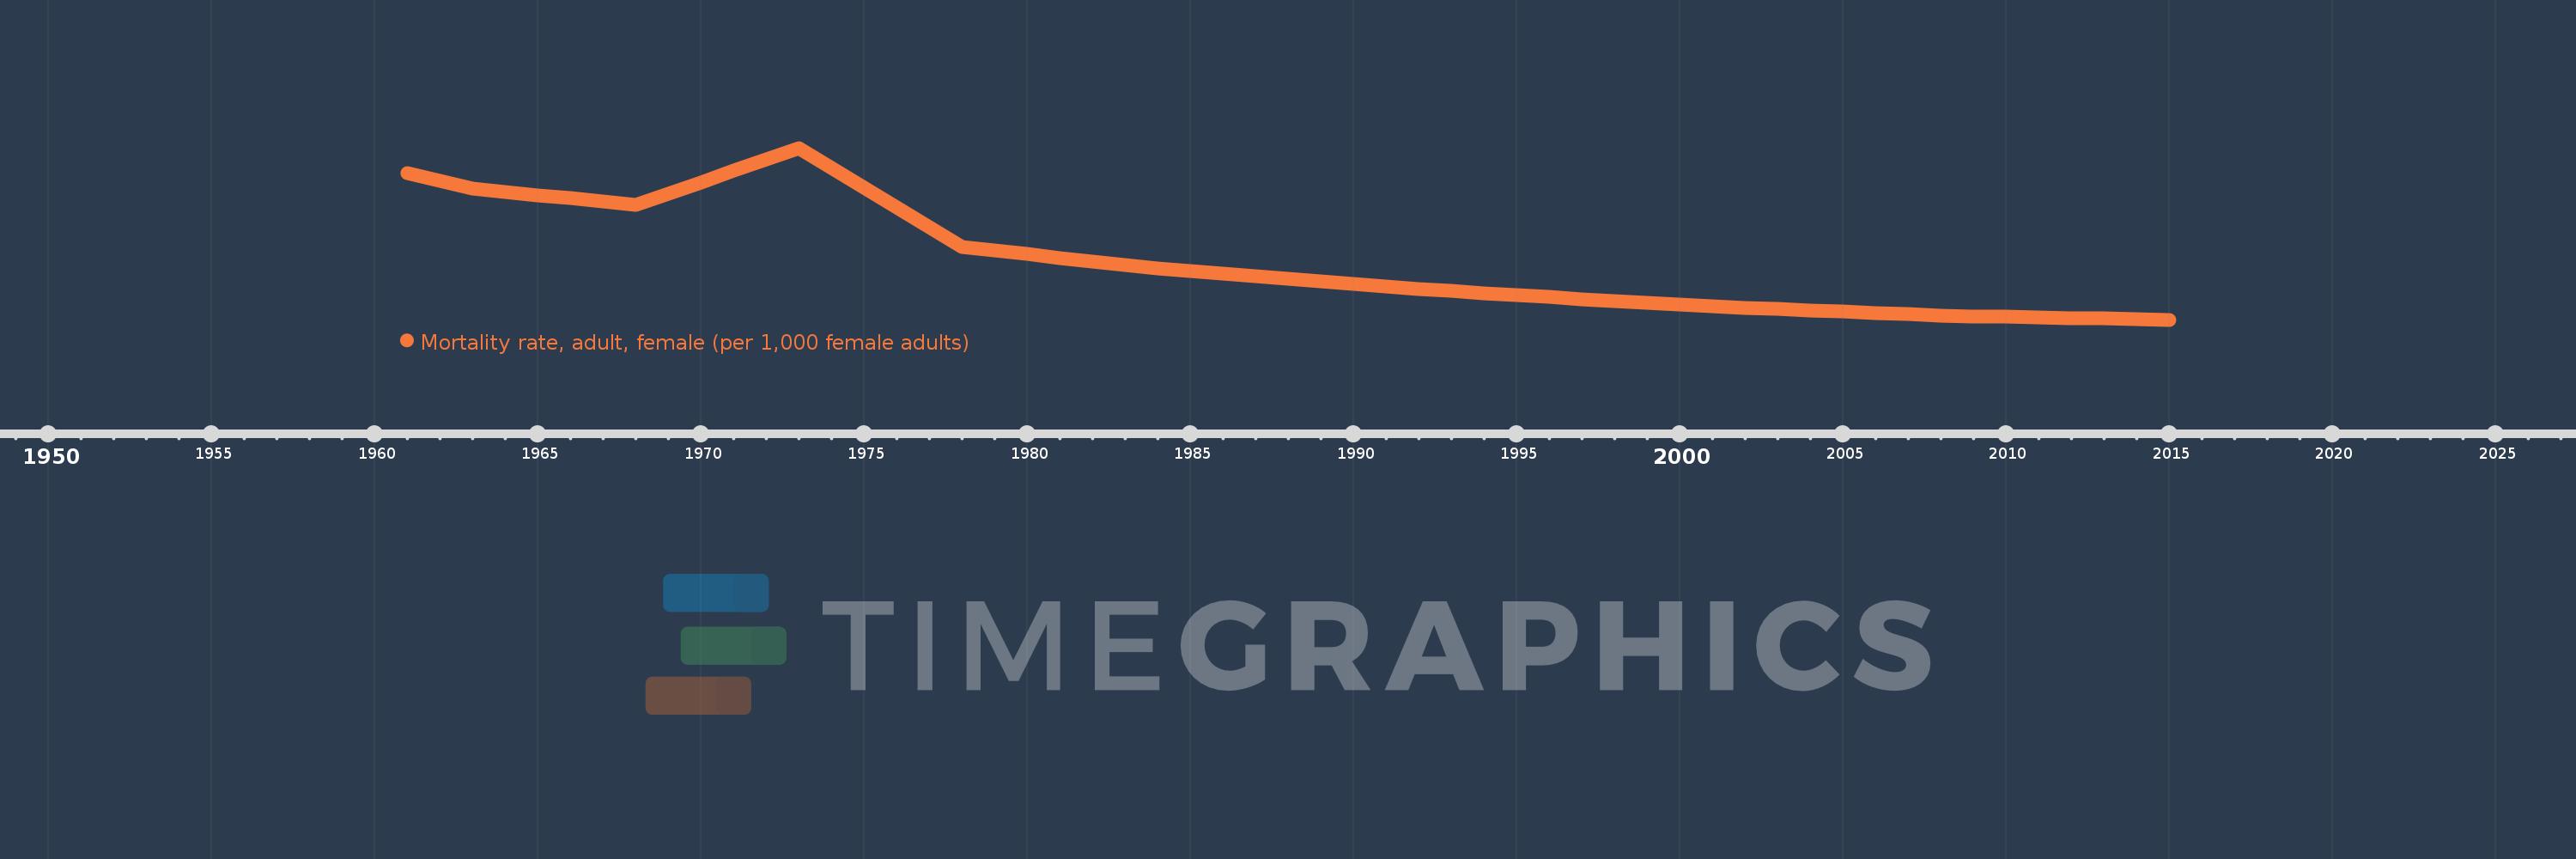
Mortality rate, adult, female (per 1,000 female adults)
2015,2014,2013,2012,2011,2010,2009,2008,2007,2006,2005,2004,2003,2002,2001,2000,1999,1998,1997,1996,1995,1994,1993,1992,1991,1990,1989,1988,1987,1986,1985,1984,1983,1982,1981,1980,1979,1978,1977,1976,1975,1974,1973,1972,1971,1970,1969,1968,1967,1966,1965,1964,1963,1962,1961
This statistics in other country:
AfghanistanAlbaniaAlgeriaAngolaAntigua and BarbudaArab WorldArgentinaArmeniaArubaAustraliaAustriaAzerbaijanBahamas, TheBahrainBangladeshBarbadosBelarusBelgiumBelizeBeninBhutanBoliviaBosnia and HerzegovinaBotswanaBrazilBrunei DarussalamBulgariaBurkina FasoBurundiCabo VerdeCambodiaCameroonCanadaCaribbean small statesCentral African RepublicCentral Europe and the BalticsChadChannel IslandsChileChinaColombiaComorosCongo, Dem. Rep.Congo, Rep.Costa RicaCote d'IvoireCroatiaCubaCuracaoCyprusCzech RepublicDenmarkDjiboutiDominicaDominican RepublicEarly-demographic dividendEast Asia & PacificEast Asia & Pacific (excluding high income)East Asia & Pacific (IDA & IBRD countries)EcuadorEgypt, Arab Rep.El SalvadorEquatorial GuineaEritreaEstoniaEthiopiaEuro areaEurope & Central AsiaEurope & Central Asia (excluding high income)Europe & Central Asia (IDA & IBRD countries)European UnionFijiFinlandFragile and conflict affected situationsFranceFrench PolynesiaGabonGambia, TheGeorgiaGermanyGhanaGreeceGreenlandGrenadaGuamGuatemalaGuineaGuinea-BissauGuyanaHaitiHeavily indebted poor countries (HIPC)High incomeHondurasHong Kong SAR, ChinaHungaryIBRD onlyIcelandIDA & IBRD totalIDA blendIDA onlyIDA totalIndiaIndonesiaIran, Islamic Rep.IraqIrelandIsraelItalyJamaicaJapanJordanKazakhstanKenyaKiribatiKorea, Dem. People’s Rep.Korea, Rep.KuwaitKyrgyz RepublicLao PDRLate-demographic dividendLatin America & Caribbean Latin America & Caribbean (excluding high income)Latin America & the Caribbean (IDA & IBRD countries)LatviaLeast developed countries: UN classificationLebanonLesothoLiberiaLibyaLithuaniaLow & middle incomeLow incomeLower middle incomeLuxembourgMacao SAR, ChinaMacedonia, FYRMadagascarMalawiMalaysiaMaldivesMaliMaltaMarshall IslandsMauritaniaMauritiusMexicoMicronesia, Fed. Sts.Middle East & North AfricaMiddle East & North Africa (excluding high income)Middle East & North Africa (IDA & IBRD countries)Middle incomeMoldovaMongoliaMontenegroMoroccoMozambiqueMyanmarNamibiaNepalNetherlandsNew CaledoniaNew ZealandNicaraguaNigerNigeriaNorth AmericaNorwayOECD membersOmanOther small statesPacific island small statesPakistanPanamaPapua New GuineaParaguayPeruPhilippinesPolandPortugalPost-demographic dividendPre-demographic dividendPuerto RicoQatarRomaniaRussian FederationRwandaSamoaSao Tome and PrincipeSaudi ArabiaSenegalSerbiaSeychellesSierra LeoneSingaporeSlovak RepublicSloveniaSmall statesSolomon IslandsSomaliaSouth AfricaSouth AsiaSouth Asia (IDA & IBRD)South SudanSpainSri LankaSt. Kitts and NevisSt. LuciaSt. Vincent and the GrenadinesSub-Saharan Africa Sub-Saharan Africa (excluding high income)Sub-Saharan Africa (IDA & IBRD countries)SudanSurinameSwazilandSwedenSwitzerlandSyrian Arab RepublicTajikistanTanzaniaThailandTimor-LesteTogoTongaTrinidad and TobagoTunisiaTurkeyTurkmenistanUgandaUkraineUnited Arab EmiratesUnited KingdomUnited StatesUpper middle incomeUruguayUzbekistanVanuatuVenezuela, RBVietnamVirgin Islands (U.S.)West Bank and GazaWorldYemen, Rep.ZambiaZimbabwe Timeline:
This timeline shows a graph from 1961 to 2015 of Vietnam. No data until 1960. Number of actual observations by date: 55.
Source name:
World Development Indicators
Source organization:
(1) United Nations Population Division. World Population Prospects. New York, United Nations, Department of Economic and Social Affairs (advanced Excel tables). Available at http://esa.un.org/wpp/unpp/panel_population.htm, (2) University of California, Berkeley, and Max Planck Institute for Demographic Research. Human Mortality Database. [ www.mortality.org or www.humanmortality.de].
Categories, topics:
Health, Gender
Last updated:
apr 23, 2017
Indicators value changes by year
Minimum:
67.717
jan 1, 2015
Maximum:
199.807
jan 1, 1973
At the date of observation
Value
Absolute change
Change from previous value
jan 1, 1961
180.603
+180.603
0.0%
jan 1, 1962
174.713
-5.89
-3.26%
jan 1, 1963
168.822
-5.891
-3.37%
jan 1, 1964
166.21
-2.612
-1.55%
jan 1, 1965
163.598
-2.612
-1.57%
jan 1, 1966
160.986
-2.612
-1.6%
jan 1, 1967
158.374
-2.612
-1.62%
jan 1, 1968
155.762
-2.612
-1.65%
jan 1, 1969
164.571
+8.809
5.66%
jan 1, 1970
173.38
+8.809
5.35%
jan 1, 1971
182.189
+8.809
5.08%
jan 1, 1972
190.998
+8.809
4.84%
jan 1, 1973
199.807
+8.809
4.61%
jan 1, 1974
184.621
-15.186
-7.6%
jan 1, 1975
169.434
-15.187
-8.23%
jan 1, 1976
154.248
-15.186
-8.96%
jan 1, 1977
139.062
-15.186
-9.85%
jan 1, 1978
123.876
-15.186
-10.92%
jan 1, 1979
121.011
-2.865
-2.31%
jan 1, 1980
118.145
-2.866
-2.37%
jan 1, 1981
115.279
-2.866
-2.43%
jan 1, 1982
112.414
-2.865
-2.49%
jan 1, 1983
109.548
-2.866
-2.55%
jan 1, 1984
107.462
-2.086
-1.9%
jan 1, 1985
105.376
-2.086
-1.94%
jan 1, 1986
103.29
-2.086
-1.98%
jan 1, 1987
101.204
-2.086
-2.02%
jan 1, 1988
99.118
-2.086
-2.06%
jan 1, 1989
97.231
-1.887
-1.9%
jan 1, 1990
95.344
-1.887
-1.94%
jan 1, 1991
93.458
-1.886
-1.98%
jan 1, 1992
91.571
-1.887
-2.02%
jan 1, 1993
89.684
-1.887
-2.06%
jan 1, 1994
88.133
-1.551
-1.73%
jan 1, 1995
86.582
-1.551
-1.76%
jan 1, 1996
85.03
-1.552
-1.79%
jan 1, 1997
83.479
-1.551
-1.82%
jan 1, 1998
81.927
-1.552
-1.86%
jan 1, 1999
80.706
-1.221
-1.49%
jan 1, 2000
79.484
-1.222
-1.51%
jan 1, 2001
78.262
-1.222
-1.54%
jan 1, 2002
77.04
-1.222
-1.56%
jan 1, 2003
75.818
-1.222
-1.59%
jan 1, 2004
74.839
-0.979
-1.29%
jan 1, 2005
73.86
-0.979
-1.31%
jan 1, 2006
72.88
-0.98
-1.33%
jan 1, 2007
71.901
-0.979
-1.34%
jan 1, 2008
70.922
-0.979
-1.36%
jan 1, 2009
70.465
-0.457
-0.64%
jan 1, 2010
70.008
-0.457
-0.65%
jan 1, 2011
69.552
-0.456
-0.65%
jan 1, 2012
69.095
-0.457
-0.66%
jan 1, 2013
68.638
-0.457
-0.66%
jan 1, 2014
68.178
-0.46
-0.67%
jan 1, 2015
67.717
-0.461
-0.68%
Ranking of countries by current statistics by years


Comments: