29
/
en
AIzaSyAYiBZKx7MnpbEhh9jyipgxe19OcubqV5w
April 1, 2024
125116
Egypt, Arab Rep.
EGY
true
2
1
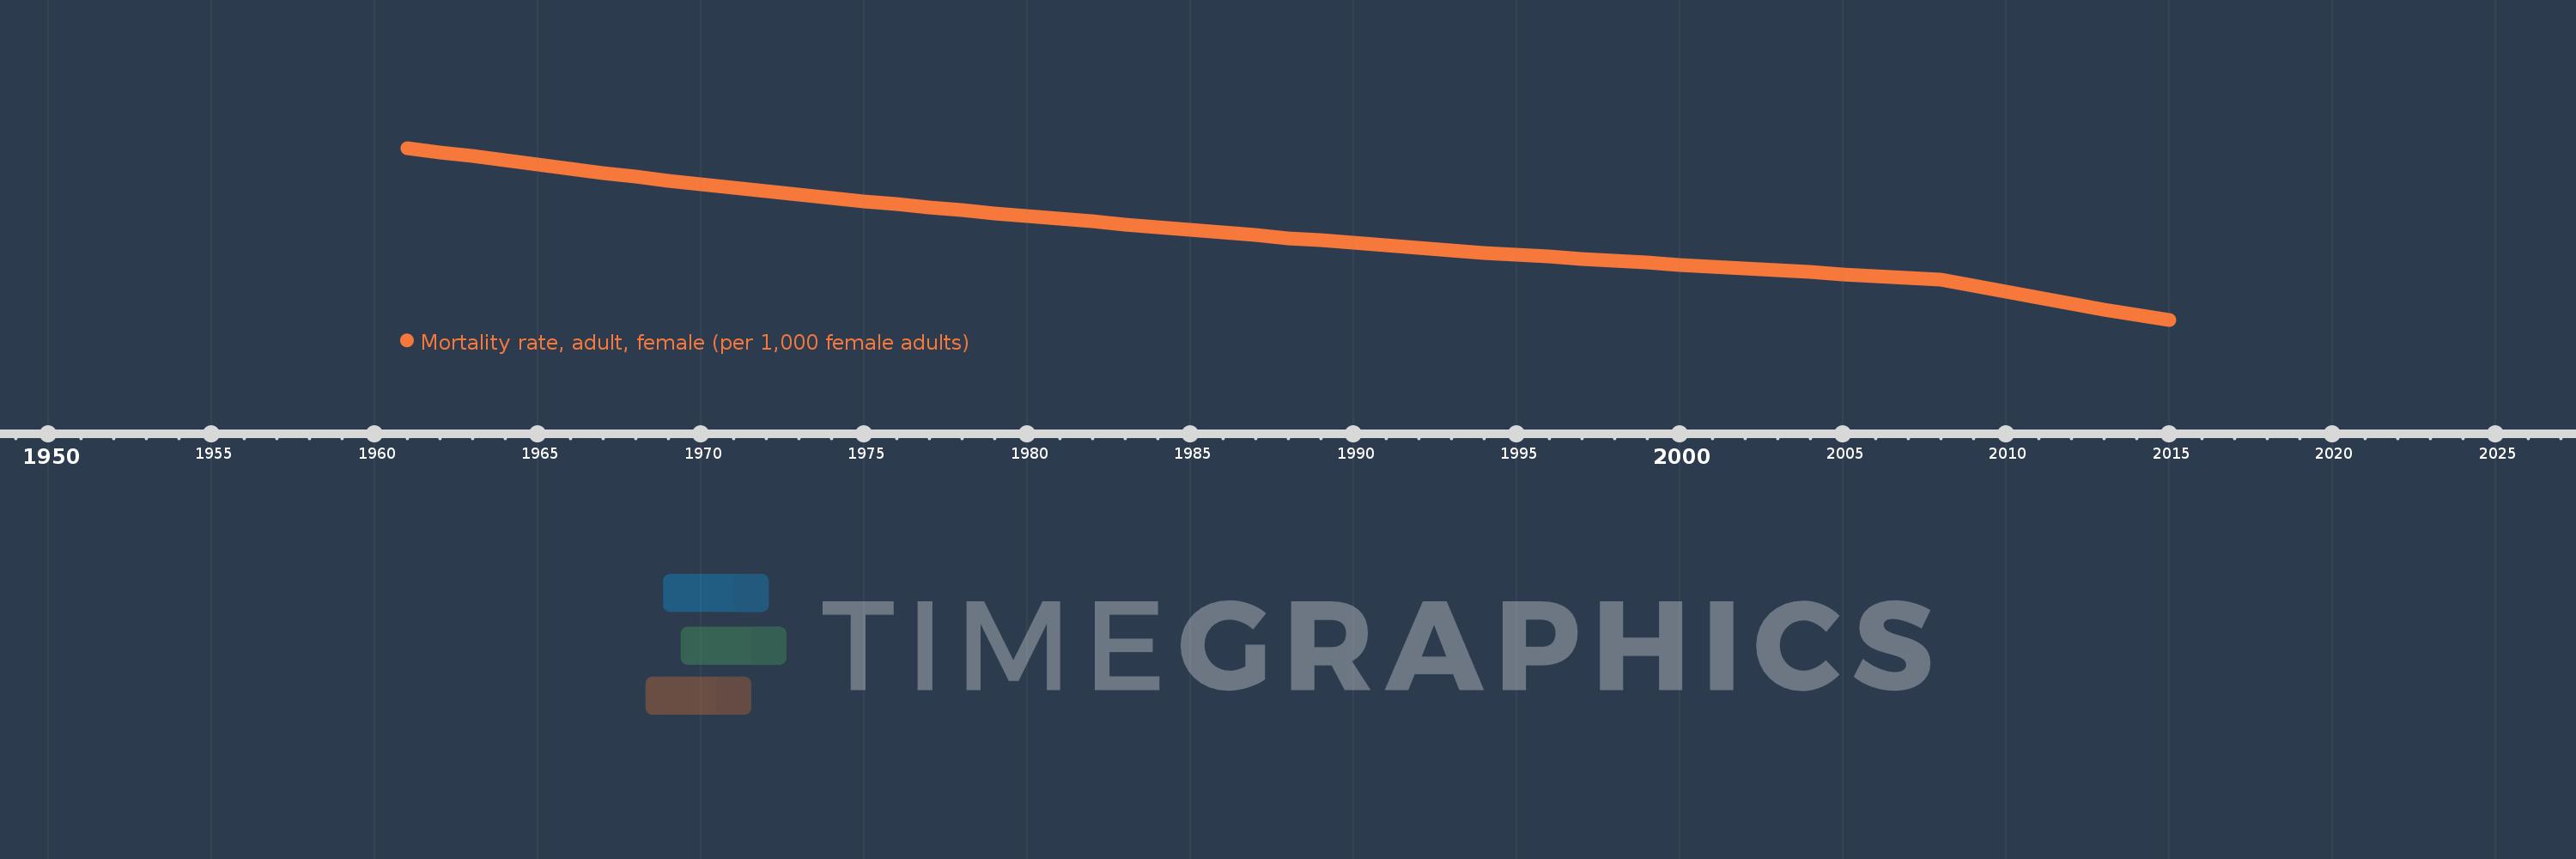
Mortality rate, adult, female (per 1,000 female adults)
2015,2014,2013,2012,2011,2010,2009,2008,2007,2006,2005,2004,2003,2002,2001,2000,1999,1998,1997,1996,1995,1994,1993,1992,1991,1990,1989,1988,1987,1986,1985,1984,1983,1982,1981,1980,1979,1978,1977,1976,1975,1974,1973,1972,1971,1970,1969,1968,1967,1966,1965,1964,1963,1962,1961
This statistics in other country:
AfghanistanAlbaniaAlgeriaAngolaAntigua and BarbudaArab WorldArgentinaArmeniaArubaAustraliaAustriaAzerbaijanBahamas, TheBahrainBangladeshBarbadosBelarusBelgiumBelizeBeninBhutanBoliviaBosnia and HerzegovinaBotswanaBrazilBrunei DarussalamBulgariaBurkina FasoBurundiCabo VerdeCambodiaCameroonCanadaCaribbean small statesCentral African RepublicCentral Europe and the BalticsChadChannel IslandsChileChinaColombiaComorosCongo, Dem. Rep.Congo, Rep.Costa RicaCote d'IvoireCroatiaCubaCuracaoCyprusCzech RepublicDenmarkDjiboutiDominicaDominican RepublicEarly-demographic dividendEast Asia & PacificEast Asia & Pacific (excluding high income)East Asia & Pacific (IDA & IBRD countries)EcuadorEgypt, Arab Rep.El SalvadorEquatorial GuineaEritreaEstoniaEthiopiaEuro areaEurope & Central AsiaEurope & Central Asia (excluding high income)Europe & Central Asia (IDA & IBRD countries)European UnionFijiFinlandFragile and conflict affected situationsFranceFrench PolynesiaGabonGambia, TheGeorgiaGermanyGhanaGreeceGreenlandGrenadaGuamGuatemalaGuineaGuinea-BissauGuyanaHaitiHeavily indebted poor countries (HIPC)High incomeHondurasHong Kong SAR, ChinaHungaryIBRD onlyIcelandIDA & IBRD totalIDA blendIDA onlyIDA totalIndiaIndonesiaIran, Islamic Rep.IraqIrelandIsraelItalyJamaicaJapanJordanKazakhstanKenyaKiribatiKorea, Dem. People’s Rep.Korea, Rep.KuwaitKyrgyz RepublicLao PDRLate-demographic dividendLatin America & Caribbean Latin America & Caribbean (excluding high income)Latin America & the Caribbean (IDA & IBRD countries)LatviaLeast developed countries: UN classificationLebanonLesothoLiberiaLibyaLithuaniaLow & middle incomeLow incomeLower middle incomeLuxembourgMacao SAR, ChinaMacedonia, FYRMadagascarMalawiMalaysiaMaldivesMaliMaltaMarshall IslandsMauritaniaMauritiusMexicoMicronesia, Fed. Sts.Middle East & North AfricaMiddle East & North Africa (excluding high income)Middle East & North Africa (IDA & IBRD countries)Middle incomeMoldovaMongoliaMontenegroMoroccoMozambiqueMyanmarNamibiaNepalNetherlandsNew CaledoniaNew ZealandNicaraguaNigerNigeriaNorth AmericaNorwayOECD membersOmanOther small statesPacific island small statesPakistanPanamaPapua New GuineaParaguayPeruPhilippinesPolandPortugalPost-demographic dividendPre-demographic dividendPuerto RicoQatarRomaniaRussian FederationRwandaSamoaSao Tome and PrincipeSaudi ArabiaSenegalSerbiaSeychellesSierra LeoneSingaporeSlovak RepublicSloveniaSmall statesSolomon IslandsSomaliaSouth AfricaSouth AsiaSouth Asia (IDA & IBRD)South SudanSpainSri LankaSt. Kitts and NevisSt. LuciaSt. Vincent and the GrenadinesSub-Saharan Africa Sub-Saharan Africa (excluding high income)Sub-Saharan Africa (IDA & IBRD countries)SudanSurinameSwazilandSwedenSwitzerlandSyrian Arab RepublicTajikistanTanzaniaThailandTimor-LesteTogoTongaTrinidad and TobagoTunisiaTurkeyTurkmenistanUgandaUkraineUnited Arab EmiratesUnited KingdomUnited StatesUpper middle incomeUruguayUzbekistanVanuatuVenezuela, RBVietnamVirgin Islands (U.S.)West Bank and GazaWorldYemen, Rep.ZambiaZimbabwe Timeline:
This timeline shows a graph from 1961 to 2015 of Egypt, Arab Rep.. No data until 1960. Number of actual observations by date: 55.
Source name:
World Development Indicators
Source organization:
(1) United Nations Population Division. World Population Prospects. New York, United Nations, Department of Economic and Social Affairs (advanced Excel tables). Available at http://esa.un.org/wpp/unpp/panel_population.htm, (2) University of California, Berkeley, and Max Planck Institute for Demographic Research. Human Mortality Database. [ www.mortality.org or www.humanmortality.de].
Categories, topics:
Health, Gender
Last updated:
apr 23, 2017
Indicators value changes by year
Minimum:
113.049
jan 1, 2015
Maximum:
183.909
jan 1, 1961
At the date of observation
Value
Absolute change
Change from previous value
jan 1, 1961
183.909
+183.909
0.0%
jan 1, 1962
182.197
-1.712
-0.93%
jan 1, 1963
180.485
-1.712
-0.94%
jan 1, 1964
178.777
-1.708
-0.95%
jan 1, 1965
177.07
-1.707
-0.95%
jan 1, 1966
175.362
-1.708
-0.96%
jan 1, 1967
173.655
-1.707
-0.97%
jan 1, 1968
171.947
-1.708
-0.98%
jan 1, 1969
170.468
-1.479
-0.86%
jan 1, 1970
168.99
-1.478
-0.87%
jan 1, 1971
167.511
-1.479
-0.88%
jan 1, 1972
166.032
-1.479
-0.88%
jan 1, 1973
164.553
-1.479
-0.89%
jan 1, 1974
163.281
-1.272
-0.77%
jan 1, 1975
162.009
-1.272
-0.78%
jan 1, 1976
160.737
-1.272
-0.79%
jan 1, 1977
159.464
-1.273
-0.79%
jan 1, 1978
158.192
-1.272
-0.8%
jan 1, 1979
157.022
-1.17
-0.74%
jan 1, 1980
155.851
-1.171
-0.75%
jan 1, 1981
154.681
-1.17
-0.75%
jan 1, 1982
153.511
-1.17
-0.76%
jan 1, 1983
152.34
-1.171
-0.76%
jan 1, 1984
151.224
-1.116
-0.73%
jan 1, 1985
150.108
-1.116
-0.74%
jan 1, 1986
148.992
-1.116
-0.74%
jan 1, 1987
147.876
-1.116
-0.75%
jan 1, 1988
146.759
-1.117
-0.76%
jan 1, 1989
145.725
-1.034
-0.7%
jan 1, 1990
144.69
-1.035
-0.71%
jan 1, 1991
143.655
-1.035
-0.72%
jan 1, 1992
142.621
-1.034
-0.72%
jan 1, 1993
141.586
-1.035
-0.73%
jan 1, 1994
140.744
-0.842
-0.59%
jan 1, 1995
139.901
-0.843
-0.6%
jan 1, 1996
139.059
-0.842
-0.6%
jan 1, 1997
138.216
-0.843
-0.61%
jan 1, 1998
137.374
-0.842
-0.61%
jan 1, 1999
136.577
-0.797
-0.58%
jan 1, 2000
135.78
-0.797
-0.58%
jan 1, 2001
134.983
-0.797
-0.59%
jan 1, 2002
134.186
-0.797
-0.59%
jan 1, 2003
133.389
-0.797
-0.59%
jan 1, 2004
132.622
-0.767
-0.58%
jan 1, 2005
131.856
-0.766
-0.58%
jan 1, 2006
131.089
-0.767
-0.58%
jan 1, 2007
130.322
-0.767
-0.59%
jan 1, 2008
129.555
-0.767
-0.59%
jan 1, 2009
127.104
-2.451
-1.89%
jan 1, 2010
124.653
-2.451
-1.93%
jan 1, 2011
122.203
-2.45
-1.97%
jan 1, 2012
119.752
-2.451
-2.01%
jan 1, 2013
117.301
-2.451
-2.05%
jan 1, 2014
115.175
-2.126
-1.81%
jan 1, 2015
113.049
-2.126
-1.85%
Ranking of countries by current statistics by years


Comments: