29
/
en
AIzaSyAYiBZKx7MnpbEhh9jyipgxe19OcubqV5w
April 1, 2024
284927
Yemen, Rep.
YEM
true
2
1
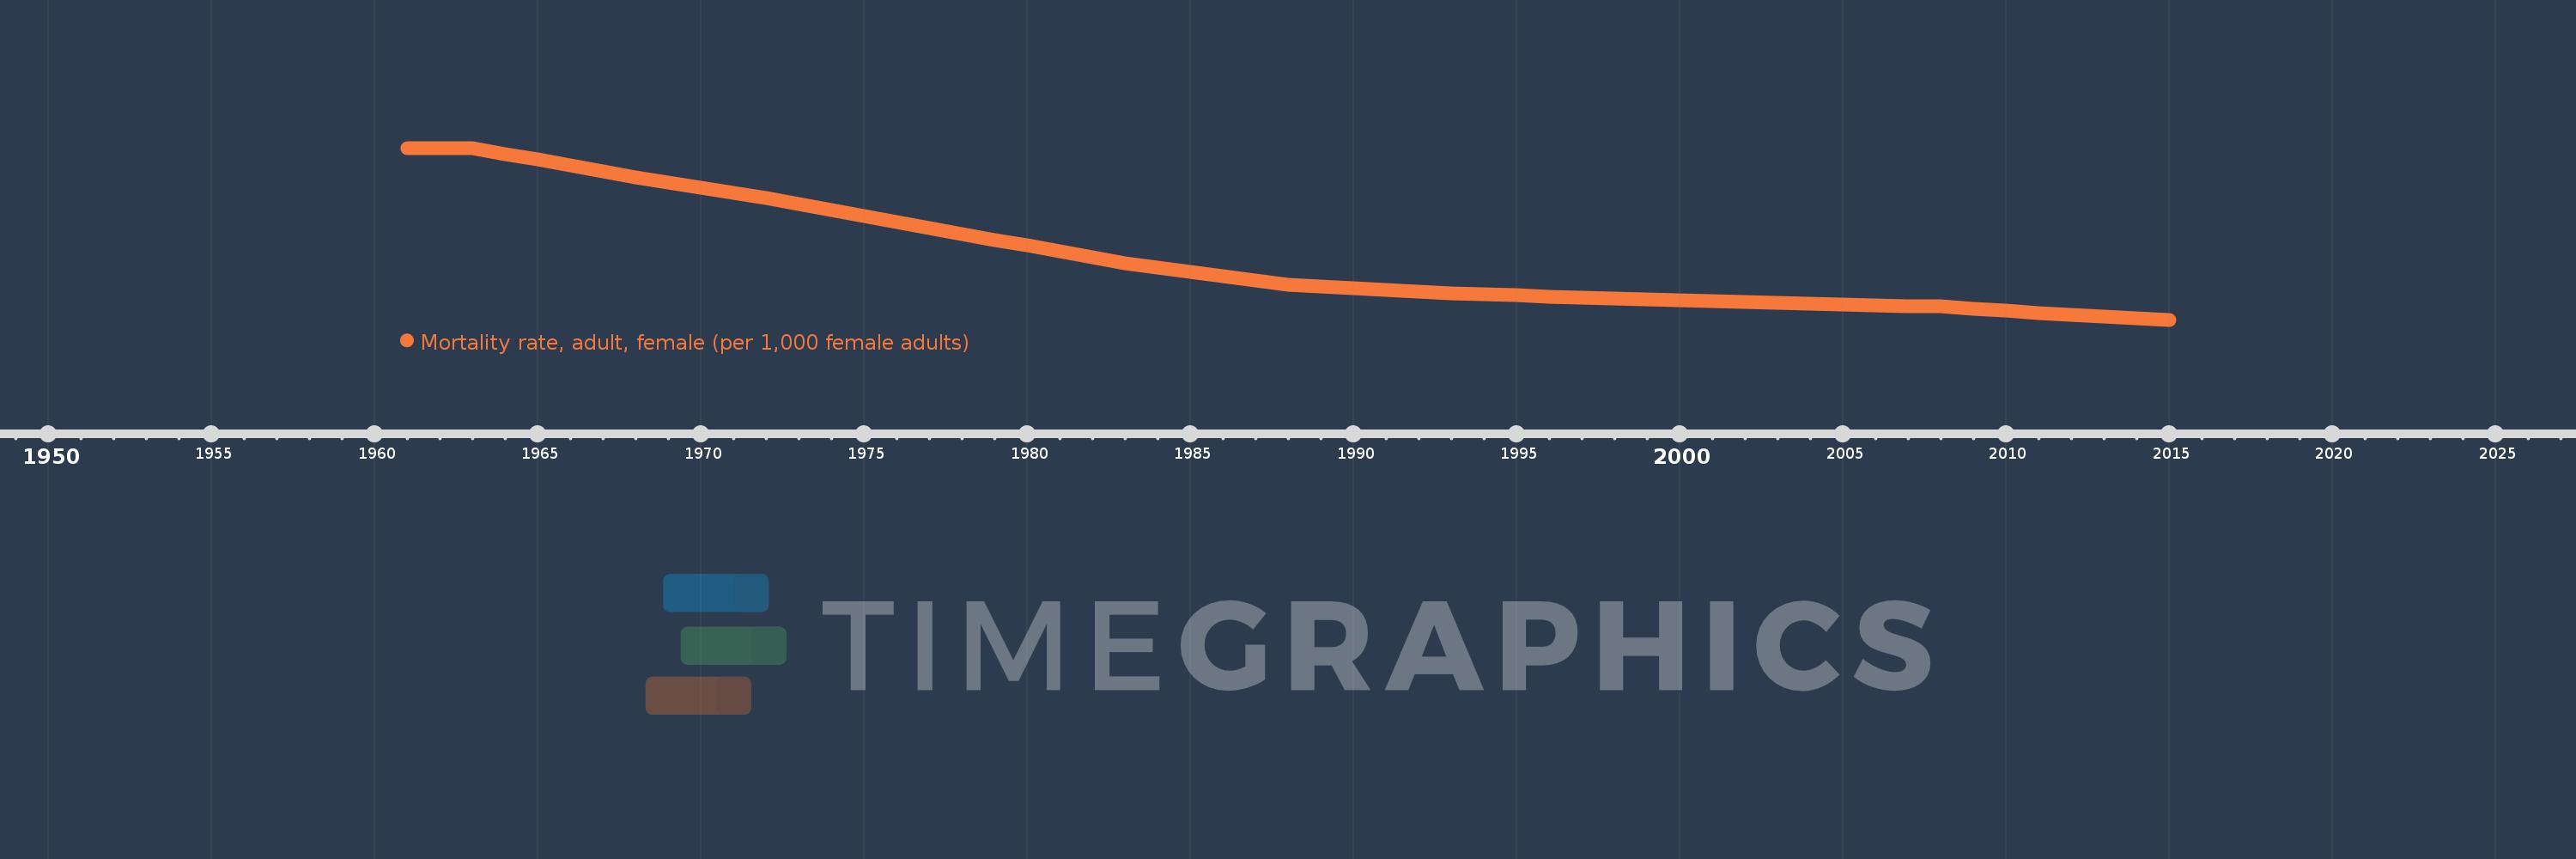
Mortality rate, adult, female (per 1,000 female adults)
2015,2014,2013,2012,2011,2010,2009,2008,2007,2006,2005,2004,2003,2002,2001,2000,1999,1998,1997,1996,1995,1994,1993,1992,1991,1990,1989,1988,1987,1986,1985,1984,1983,1982,1981,1980,1979,1978,1977,1976,1975,1974,1973,1972,1971,1970,1969,1968,1967,1966,1965,1964,1963,1962,1961
This statistics in other country:
AfghanistanAlbaniaAlgeriaAngolaAntigua and BarbudaArab WorldArgentinaArmeniaArubaAustraliaAustriaAzerbaijanBahamas, TheBahrainBangladeshBarbadosBelarusBelgiumBelizeBeninBhutanBoliviaBosnia and HerzegovinaBotswanaBrazilBrunei DarussalamBulgariaBurkina FasoBurundiCabo VerdeCambodiaCameroonCanadaCaribbean small statesCentral African RepublicCentral Europe and the BalticsChadChannel IslandsChileChinaColombiaComorosCongo, Dem. Rep.Congo, Rep.Costa RicaCote d'IvoireCroatiaCubaCuracaoCyprusCzech RepublicDenmarkDjiboutiDominicaDominican RepublicEarly-demographic dividendEast Asia & PacificEast Asia & Pacific (excluding high income)East Asia & Pacific (IDA & IBRD countries)EcuadorEgypt, Arab Rep.El SalvadorEquatorial GuineaEritreaEstoniaEthiopiaEuro areaEurope & Central AsiaEurope & Central Asia (excluding high income)Europe & Central Asia (IDA & IBRD countries)European UnionFijiFinlandFragile and conflict affected situationsFranceFrench PolynesiaGabonGambia, TheGeorgiaGermanyGhanaGreeceGreenlandGrenadaGuamGuatemalaGuineaGuinea-BissauGuyanaHaitiHeavily indebted poor countries (HIPC)High incomeHondurasHong Kong SAR, ChinaHungaryIBRD onlyIcelandIDA & IBRD totalIDA blendIDA onlyIDA totalIndiaIndonesiaIran, Islamic Rep.IraqIrelandIsraelItalyJamaicaJapanJordanKazakhstanKenyaKiribatiKorea, Dem. People’s Rep.Korea, Rep.KuwaitKyrgyz RepublicLao PDRLate-demographic dividendLatin America & Caribbean Latin America & Caribbean (excluding high income)Latin America & the Caribbean (IDA & IBRD countries)LatviaLeast developed countries: UN classificationLebanonLesothoLiberiaLibyaLithuaniaLow & middle incomeLow incomeLower middle incomeLuxembourgMacao SAR, ChinaMacedonia, FYRMadagascarMalawiMalaysiaMaldivesMaliMaltaMarshall IslandsMauritaniaMauritiusMexicoMicronesia, Fed. Sts.Middle East & North AfricaMiddle East & North Africa (excluding high income)Middle East & North Africa (IDA & IBRD countries)Middle incomeMoldovaMongoliaMontenegroMoroccoMozambiqueMyanmarNamibiaNepalNetherlandsNew CaledoniaNew ZealandNicaraguaNigerNigeriaNorth AmericaNorwayOECD membersOmanOther small statesPacific island small statesPakistanPanamaPapua New GuineaParaguayPeruPhilippinesPolandPortugalPost-demographic dividendPre-demographic dividendPuerto RicoQatarRomaniaRussian FederationRwandaSamoaSao Tome and PrincipeSaudi ArabiaSenegalSerbiaSeychellesSierra LeoneSingaporeSlovak RepublicSloveniaSmall statesSolomon IslandsSomaliaSouth AfricaSouth AsiaSouth Asia (IDA & IBRD)South SudanSpainSri LankaSt. Kitts and NevisSt. LuciaSt. Vincent and the GrenadinesSub-Saharan Africa Sub-Saharan Africa (excluding high income)Sub-Saharan Africa (IDA & IBRD countries)SudanSurinameSwazilandSwedenSwitzerlandSyrian Arab RepublicTajikistanTanzaniaThailandTimor-LesteTogoTongaTrinidad and TobagoTunisiaTurkeyTurkmenistanUgandaUkraineUnited Arab EmiratesUnited KingdomUnited StatesUpper middle incomeUruguayUzbekistanVanuatuVenezuela, RBVietnamVirgin Islands (U.S.)West Bank and GazaWorldYemen, Rep.ZambiaZimbabwe Timeline:
This timeline shows a graph from 1961 to 2015 of Yemen, Rep.. No data until 1960. Number of actual observations by date: 55.
Source name:
World Development Indicators
Source organization:
(1) United Nations Population Division. World Population Prospects. New York, United Nations, Department of Economic and Social Affairs (advanced Excel tables). Available at http://esa.un.org/wpp/unpp/panel_population.htm, (2) University of California, Berkeley, and Max Planck Institute for Demographic Research. Human Mortality Database. [ www.mortality.org or www.humanmortality.de].
Categories, topics:
Health, Gender
Last updated:
apr 23, 2017
Indicators value changes by year
Minimum:
201.495
jan 1, 2015
Maximum:
459.634
jan 1, 1961
At the date of observation
Value
Absolute change
Change from previous value
jan 1, 1961
459.634
+459.634
0.0%
jan 1, 1962
459.634
0.0
0.0%
jan 1, 1963
459.634
0.0
0.0%
jan 1, 1964
450.786
-8.848
-1.93%
jan 1, 1965
441.938
-8.848
-1.96%
jan 1, 1966
433.089
-8.849
-2.0%
jan 1, 1967
424.241
-8.848
-2.04%
jan 1, 1968
415.393
-8.848
-2.09%
jan 1, 1969
407.496
-7.897
-1.9%
jan 1, 1970
399.599
-7.897
-1.94%
jan 1, 1971
391.701
-7.898
-1.98%
jan 1, 1972
383.804
-7.897
-2.02%
jan 1, 1973
375.907
-7.897
-2.06%
jan 1, 1974
366.858
-9.049
-2.41%
jan 1, 1975
357.809
-9.049
-2.47%
jan 1, 1976
348.76
-9.049
-2.53%
jan 1, 1977
339.711
-9.049
-2.59%
jan 1, 1978
330.662
-9.049
-2.66%
jan 1, 1979
321.744
-8.918
-2.7%
jan 1, 1980
312.826
-8.918
-2.77%
jan 1, 1981
303.908
-8.918
-2.85%
jan 1, 1982
294.989
-8.919
-2.93%
jan 1, 1983
286.071
-8.918
-3.02%
jan 1, 1984
279.758
-6.313
-2.21%
jan 1, 1985
273.446
-6.312
-2.26%
jan 1, 1986
267.133
-6.313
-2.31%
jan 1, 1987
260.82
-6.313
-2.36%
jan 1, 1988
254.507
-6.313
-2.42%
jan 1, 1989
251.901
-2.606
-1.02%
jan 1, 1990
249.295
-2.606
-1.03%
jan 1, 1991
246.69
-2.605
-1.04%
jan 1, 1992
244.084
-2.606
-1.06%
jan 1, 1993
241.478
-2.606
-1.07%
jan 1, 1994
239.819
-1.659
-0.69%
jan 1, 1995
238.16
-1.659
-0.69%
jan 1, 1996
236.501
-1.659
-0.7%
jan 1, 1997
234.842
-1.659
-0.7%
jan 1, 1998
233.183
-1.659
-0.71%
jan 1, 1999
231.881
-1.302
-0.56%
jan 1, 2000
230.579
-1.302
-0.56%
jan 1, 2001
229.277
-1.302
-0.56%
jan 1, 2002
227.976
-1.301
-0.57%
jan 1, 2003
226.674
-1.302
-0.57%
jan 1, 2004
225.598
-1.076
-0.47%
jan 1, 2005
224.521
-1.077
-0.48%
jan 1, 2006
223.445
-1.076
-0.48%
jan 1, 2007
222.369
-1.076
-0.48%
jan 1, 2008
221.292
-1.077
-0.48%
jan 1, 2009
218.204
-3.088
-1.4%
jan 1, 2010
215.115
-3.089
-1.42%
jan 1, 2011
212.027
-3.088
-1.44%
jan 1, 2012
208.938
-3.089
-1.46%
jan 1, 2013
205.85
-3.088
-1.48%
jan 1, 2014
203.672
-2.178
-1.06%
jan 1, 2015
201.495
-2.177
-1.07%
Ranking of countries by current statistics by years


Comments: