29
/
en
AIzaSyAYiBZKx7MnpbEhh9jyipgxe19OcubqV5w
April 1, 2024
92819
Brunei Darussalam
BRN
true
2
1
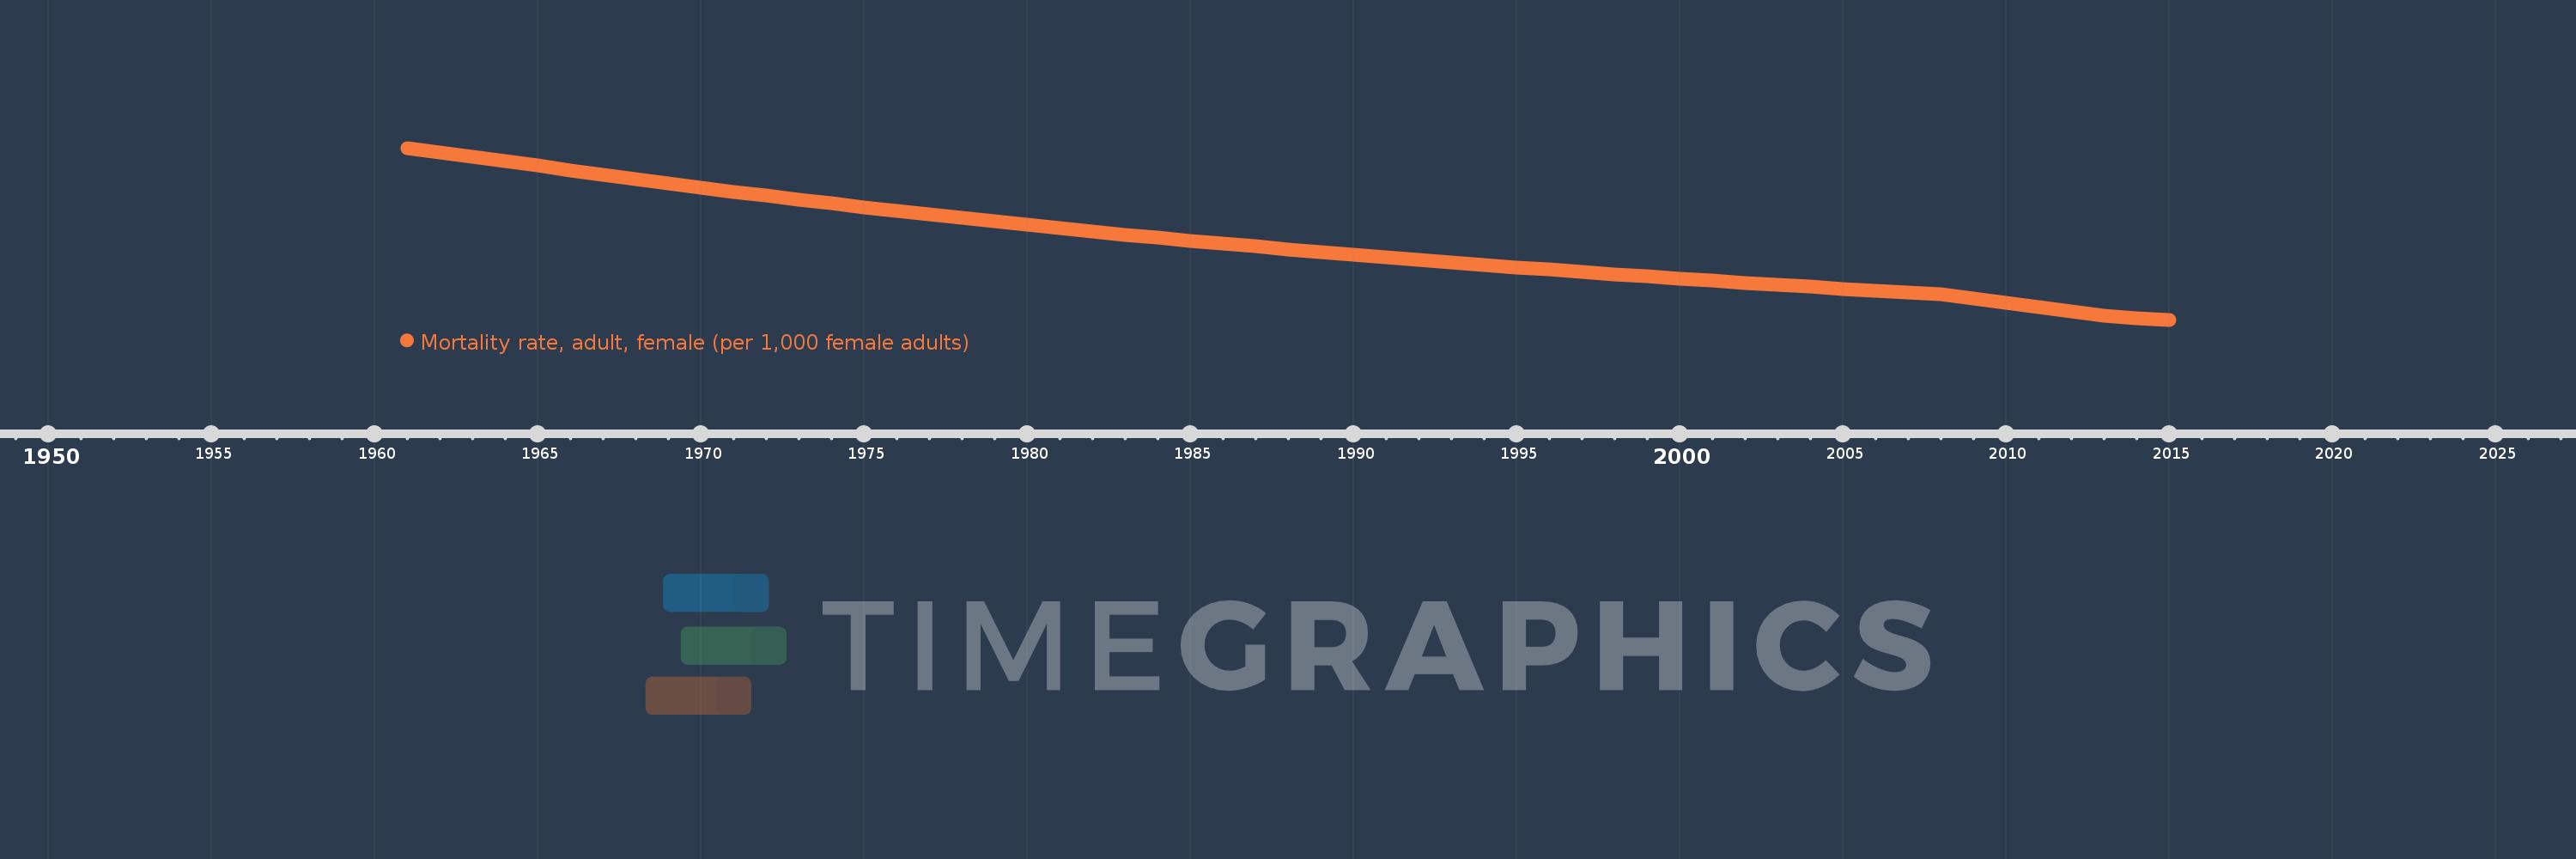
Mortality rate, adult, female (per 1,000 female adults)
2015,2014,2013,2012,2011,2010,2009,2008,2007,2006,2005,2004,2003,2002,2001,2000,1999,1998,1997,1996,1995,1994,1993,1992,1991,1990,1989,1988,1987,1986,1985,1984,1983,1982,1981,1980,1979,1978,1977,1976,1975,1974,1973,1972,1971,1970,1969,1968,1967,1966,1965,1964,1963,1962,1961
This statistics in other country:
AfghanistanAlbaniaAlgeriaAngolaAntigua and BarbudaArab WorldArgentinaArmeniaArubaAustraliaAustriaAzerbaijanBahamas, TheBahrainBangladeshBarbadosBelarusBelgiumBelizeBeninBhutanBoliviaBosnia and HerzegovinaBotswanaBrazilBrunei DarussalamBulgariaBurkina FasoBurundiCabo VerdeCambodiaCameroonCanadaCaribbean small statesCentral African RepublicCentral Europe and the BalticsChadChannel IslandsChileChinaColombiaComorosCongo, Dem. Rep.Congo, Rep.Costa RicaCote d'IvoireCroatiaCubaCuracaoCyprusCzech RepublicDenmarkDjiboutiDominicaDominican RepublicEarly-demographic dividendEast Asia & PacificEast Asia & Pacific (excluding high income)East Asia & Pacific (IDA & IBRD countries)EcuadorEgypt, Arab Rep.El SalvadorEquatorial GuineaEritreaEstoniaEthiopiaEuro areaEurope & Central AsiaEurope & Central Asia (excluding high income)Europe & Central Asia (IDA & IBRD countries)European UnionFijiFinlandFragile and conflict affected situationsFranceFrench PolynesiaGabonGambia, TheGeorgiaGermanyGhanaGreeceGreenlandGrenadaGuamGuatemalaGuineaGuinea-BissauGuyanaHaitiHeavily indebted poor countries (HIPC)High incomeHondurasHong Kong SAR, ChinaHungaryIBRD onlyIcelandIDA & IBRD totalIDA blendIDA onlyIDA totalIndiaIndonesiaIran, Islamic Rep.IraqIrelandIsraelItalyJamaicaJapanJordanKazakhstanKenyaKiribatiKorea, Dem. People’s Rep.Korea, Rep.KuwaitKyrgyz RepublicLao PDRLate-demographic dividendLatin America & Caribbean Latin America & Caribbean (excluding high income)Latin America & the Caribbean (IDA & IBRD countries)LatviaLeast developed countries: UN classificationLebanonLesothoLiberiaLibyaLithuaniaLow & middle incomeLow incomeLower middle incomeLuxembourgMacao SAR, ChinaMacedonia, FYRMadagascarMalawiMalaysiaMaldivesMaliMaltaMarshall IslandsMauritaniaMauritiusMexicoMicronesia, Fed. Sts.Middle East & North AfricaMiddle East & North Africa (excluding high income)Middle East & North Africa (IDA & IBRD countries)Middle incomeMoldovaMongoliaMontenegroMoroccoMozambiqueMyanmarNamibiaNepalNetherlandsNew CaledoniaNew ZealandNicaraguaNigerNigeriaNorth AmericaNorwayOECD membersOmanOther small statesPacific island small statesPakistanPanamaPapua New GuineaParaguayPeruPhilippinesPolandPortugalPost-demographic dividendPre-demographic dividendPuerto RicoQatarRomaniaRussian FederationRwandaSamoaSao Tome and PrincipeSaudi ArabiaSenegalSerbiaSeychellesSierra LeoneSingaporeSlovak RepublicSloveniaSmall statesSolomon IslandsSomaliaSouth AfricaSouth AsiaSouth Asia (IDA & IBRD)South SudanSpainSri LankaSt. Kitts and NevisSt. LuciaSt. Vincent and the GrenadinesSub-Saharan Africa Sub-Saharan Africa (excluding high income)Sub-Saharan Africa (IDA & IBRD countries)SudanSurinameSwazilandSwedenSwitzerlandSyrian Arab RepublicTajikistanTanzaniaThailandTimor-LesteTogoTongaTrinidad and TobagoTunisiaTurkeyTurkmenistanUgandaUkraineUnited Arab EmiratesUnited KingdomUnited StatesUpper middle incomeUruguayUzbekistanVanuatuVenezuela, RBVietnamVirgin Islands (U.S.)West Bank and GazaWorldYemen, Rep.ZambiaZimbabwe Timeline:
This timeline shows a graph from 1961 to 2015 of Brunei Darussalam. No data until 1960. Number of actual observations by date: 55.
Source name:
World Development Indicators
Source organization:
(1) United Nations Population Division. World Population Prospects. New York, United Nations, Department of Economic and Social Affairs (advanced Excel tables). Available at http://esa.un.org/wpp/unpp/panel_population.htm, (2) University of California, Berkeley, and Max Planck Institute for Demographic Research. Human Mortality Database. [ www.mortality.org or www.humanmortality.de].
Categories, topics:
Health, Gender
Last updated:
apr 23, 2017
Indicators value changes by year
Minimum:
52.105
jan 1, 2015
Maximum:
215.399
jan 1, 1961
At the date of observation
Value
Absolute change
Change from previous value
jan 1, 1961
215.399
+215.399
0.0%
jan 1, 1962
211.242
-4.157
-1.93%
jan 1, 1963
207.085
-4.157
-1.97%
jan 1, 1964
202.77
-4.315
-2.08%
jan 1, 1965
198.455
-4.315
-2.13%
jan 1, 1966
194.139
-4.316
-2.17%
jan 1, 1967
189.824
-4.315
-2.22%
jan 1, 1968
185.509
-4.315
-2.27%
jan 1, 1969
181.624
-3.885
-2.09%
jan 1, 1970
177.738
-3.886
-2.14%
jan 1, 1971
173.853
-3.885
-2.19%
jan 1, 1972
169.968
-3.885
-2.23%
jan 1, 1973
166.082
-3.886
-2.29%
jan 1, 1974
162.591
-3.491
-2.1%
jan 1, 1975
159.1
-3.491
-2.15%
jan 1, 1976
155.609
-3.491
-2.19%
jan 1, 1977
152.117
-3.492
-2.24%
jan 1, 1978
148.626
-3.491
-2.29%
jan 1, 1979
145.494
-3.132
-2.11%
jan 1, 1980
142.362
-3.132
-2.15%
jan 1, 1981
139.23
-3.132
-2.2%
jan 1, 1982
136.098
-3.132
-2.25%
jan 1, 1983
132.966
-3.132
-2.3%
jan 1, 1984
130.16
-2.806
-2.11%
jan 1, 1985
127.354
-2.806
-2.16%
jan 1, 1986
124.548
-2.806
-2.2%
jan 1, 1987
121.742
-2.806
-2.25%
jan 1, 1988
118.936
-2.806
-2.3%
jan 1, 1989
116.424
-2.512
-2.11%
jan 1, 1990
113.913
-2.511
-2.16%
jan 1, 1991
111.401
-2.512
-2.21%
jan 1, 1992
108.89
-2.511
-2.25%
jan 1, 1993
106.378
-2.512
-2.31%
jan 1, 1994
104.132
-2.246
-2.11%
jan 1, 1995
101.886
-2.246
-2.16%
jan 1, 1996
99.64
-2.246
-2.2%
jan 1, 1997
97.394
-2.246
-2.25%
jan 1, 1998
95.148
-2.246
-2.31%
jan 1, 1999
93.14
-2.008
-2.11%
jan 1, 2000
91.133
-2.007
-2.15%
jan 1, 2001
89.125
-2.008
-2.2%
jan 1, 2002
87.117
-2.008
-2.25%
jan 1, 2003
85.11
-2.007
-2.3%
jan 1, 2004
83.316
-1.794
-2.11%
jan 1, 2005
81.523
-1.793
-2.15%
jan 1, 2006
79.729
-1.794
-2.2%
jan 1, 2007
77.935
-1.794
-2.25%
jan 1, 2008
76.142
-1.793
-2.3%
jan 1, 2009
72.045
-4.097
-5.38%
jan 1, 2010
67.947
-4.098
-5.69%
jan 1, 2011
63.85
-4.097
-6.03%
jan 1, 2012
59.753
-4.097
-6.42%
jan 1, 2013
55.656
-4.097
-6.86%
jan 1, 2014
53.88
-1.776
-3.19%
jan 1, 2015
52.105
-1.775
-3.29%
Ranking of countries by current statistics by years


Comments: