29
/
en
AIzaSyAYiBZKx7MnpbEhh9jyipgxe19OcubqV5w
April 1, 2024
226189
Portugal
PRT
true
2
1
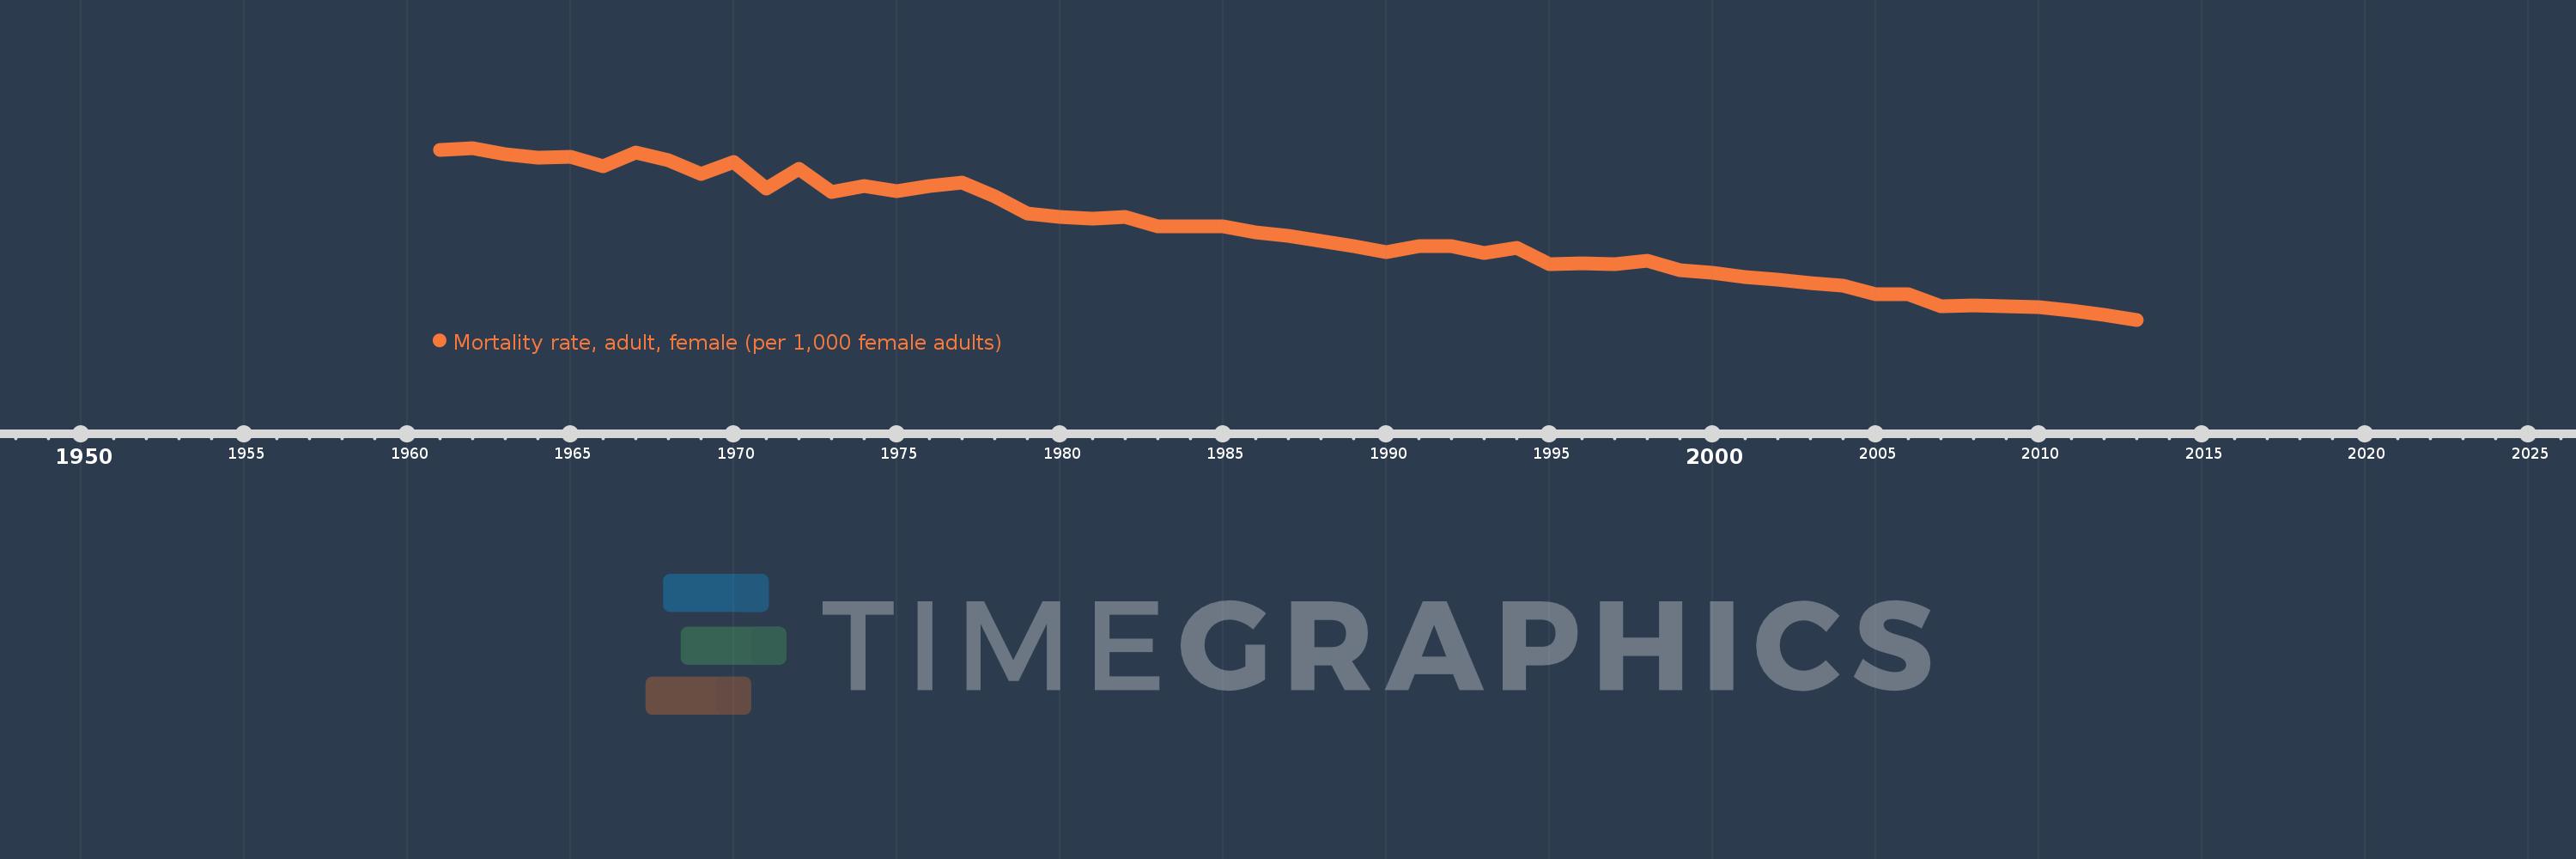
Mortality rate, adult, female (per 1,000 female adults)
2013,2012,2011,2010,2009,2008,2007,2006,2005,2004,2003,2002,2001,2000,1999,1998,1997,1996,1995,1994,1993,1992,1991,1990,1989,1988,1987,1986,1985,1984,1983,1982,1981,1980,1979,1978,1977,1976,1975,1974,1973,1972,1971,1970,1969,1968,1967,1966,1965,1964,1963,1962,1961
This statistics in other country:
AfghanistanAlbaniaAlgeriaAngolaAntigua and BarbudaArab WorldArgentinaArmeniaArubaAustraliaAustriaAzerbaijanBahamas, TheBahrainBangladeshBarbadosBelarusBelgiumBelizeBeninBhutanBoliviaBosnia and HerzegovinaBotswanaBrazilBrunei DarussalamBulgariaBurkina FasoBurundiCabo VerdeCambodiaCameroonCanadaCaribbean small statesCentral African RepublicCentral Europe and the BalticsChadChannel IslandsChileChinaColombiaComorosCongo, Dem. Rep.Congo, Rep.Costa RicaCote d'IvoireCroatiaCubaCuracaoCyprusCzech RepublicDenmarkDjiboutiDominicaDominican RepublicEarly-demographic dividendEast Asia & PacificEast Asia & Pacific (excluding high income)East Asia & Pacific (IDA & IBRD countries)EcuadorEgypt, Arab Rep.El SalvadorEquatorial GuineaEritreaEstoniaEthiopiaEuro areaEurope & Central AsiaEurope & Central Asia (excluding high income)Europe & Central Asia (IDA & IBRD countries)European UnionFijiFinlandFragile and conflict affected situationsFranceFrench PolynesiaGabonGambia, TheGeorgiaGermanyGhanaGreeceGreenlandGrenadaGuamGuatemalaGuineaGuinea-BissauGuyanaHaitiHeavily indebted poor countries (HIPC)High incomeHondurasHong Kong SAR, ChinaHungaryIBRD onlyIcelandIDA & IBRD totalIDA blendIDA onlyIDA totalIndiaIndonesiaIran, Islamic Rep.IraqIrelandIsraelItalyJamaicaJapanJordanKazakhstanKenyaKiribatiKorea, Dem. People’s Rep.Korea, Rep.KuwaitKyrgyz RepublicLao PDRLate-demographic dividendLatin America & Caribbean Latin America & Caribbean (excluding high income)Latin America & the Caribbean (IDA & IBRD countries)LatviaLeast developed countries: UN classificationLebanonLesothoLiberiaLibyaLithuaniaLow & middle incomeLow incomeLower middle incomeLuxembourgMacao SAR, ChinaMacedonia, FYRMadagascarMalawiMalaysiaMaldivesMaliMaltaMarshall IslandsMauritaniaMauritiusMexicoMicronesia, Fed. Sts.Middle East & North AfricaMiddle East & North Africa (excluding high income)Middle East & North Africa (IDA & IBRD countries)Middle incomeMoldovaMongoliaMontenegroMoroccoMozambiqueMyanmarNamibiaNepalNetherlandsNew CaledoniaNew ZealandNicaraguaNigerNigeriaNorth AmericaNorwayOECD membersOmanOther small statesPacific island small statesPakistanPanamaPapua New GuineaParaguayPeruPhilippinesPolandPortugalPost-demographic dividendPre-demographic dividendPuerto RicoQatarRomaniaRussian FederationRwandaSamoaSao Tome and PrincipeSaudi ArabiaSenegalSerbiaSeychellesSierra LeoneSingaporeSlovak RepublicSloveniaSmall statesSolomon IslandsSomaliaSouth AfricaSouth AsiaSouth Asia (IDA & IBRD)South SudanSpainSri LankaSt. Kitts and NevisSt. LuciaSt. Vincent and the GrenadinesSub-Saharan Africa Sub-Saharan Africa (excluding high income)Sub-Saharan Africa (IDA & IBRD countries)SudanSurinameSwazilandSwedenSwitzerlandSyrian Arab RepublicTajikistanTanzaniaThailandTimor-LesteTogoTongaTrinidad and TobagoTunisiaTurkeyTurkmenistanUgandaUkraineUnited Arab EmiratesUnited KingdomUnited StatesUpper middle incomeUruguayUzbekistanVanuatuVenezuela, RBVietnamVirgin Islands (U.S.)West Bank and GazaWorldYemen, Rep.ZambiaZimbabwe Timeline:
This timeline shows a graph from 1961 to 2013 of Portugal. No data until 1960. Number of actual observations by date: 53.
Source name:
World Development Indicators
Source organization:
(1) United Nations Population Division. World Population Prospects. New York, United Nations, Department of Economic and Social Affairs (advanced Excel tables). Available at http://esa.un.org/wpp/unpp/panel_population.htm, (2) University of California, Berkeley, and Max Planck Institute for Demographic Research. Human Mortality Database. [ www.mortality.org or www.humanmortality.de].
Categories, topics:
Health, Gender
Last updated:
apr 23, 2017
Indicators value changes by year
Minimum:
46.977
jan 1, 2013
Maximum:
122.53
jan 1, 1962
At the date of observation
Value
Absolute change
Change from previous value
jan 1, 1961
121.561
+121.561
0.0%
jan 1, 1962
122.53
+0.969
0.8%
jan 1, 1963
119.625
-2.905
-2.37%
jan 1, 1964
118.166
-1.459
-1.22%
jan 1, 1965
118.603
+0.437
0.37%
jan 1, 1966
114.629
-3.974
-3.35%
jan 1, 1967
120.453
+5.824
5.08%
jan 1, 1968
117.311
-3.142
-2.61%
jan 1, 1969
111.084
-6.227
-5.31%
jan 1, 1970
116.515
+5.431
4.89%
jan 1, 1971
104.838
-11.677
-10.02%
jan 1, 1972
113.411
+8.573
8.18%
jan 1, 1973
103.06
-10.351
-9.13%
jan 1, 1974
105.838
+2.778
2.7%
jan 1, 1975
103.545
-2.293
-2.17%
jan 1, 1976
105.87
+2.325
2.25%
jan 1, 1977
107.438
+1.568
1.48%
jan 1, 1978
101.429
-6.009
-5.59%
jan 1, 1979
93.82
-7.609
-7.5%
jan 1, 1980
92.291
-1.529
-1.63%
jan 1, 1981
91.515
-0.776
-0.84%
jan 1, 1982
92.337
+0.822
0.9%
jan 1, 1983
88.078
-4.259
-4.61%
jan 1, 1984
88.218
+0.14
0.16%
jan 1, 1985
87.936
-0.282
-0.32%
jan 1, 1986
85.361
-2.575
-2.93%
jan 1, 1987
83.75
-1.611
-1.89%
jan 1, 1988
81.603
-2.147
-2.56%
jan 1, 1989
79.215
-2.388
-2.93%
jan 1, 1990
76.706
-2.509
-3.17%
jan 1, 1991
79.302
+2.596
3.38%
jan 1, 1992
79.354
+0.052
0.07%
jan 1, 1993
76.377
-2.977
-3.75%
jan 1, 1994
78.699
+2.322
3.04%
jan 1, 1995
71.432
-7.267
-9.23%
jan 1, 1996
71.694
+0.262
0.37%
jan 1, 1997
71.548
-0.146
-0.2%
jan 1, 1998
72.744
+1.196
1.67%
jan 1, 1999
68.812
-3.932
-5.41%
jan 1, 2000
67.489
-1.323
-1.92%
jan 1, 2001
65.723
-1.766
-2.62%
jan 1, 2002
64.697
-1.026
-1.56%
jan 1, 2003
63.264
-1.433
-2.21%
jan 1, 2004
62.156
-1.108
-1.75%
jan 1, 2005
58.27
-3.886
-6.25%
jan 1, 2006
58.045
-0.225
-0.39%
jan 1, 2007
52.838
-5.207
-8.97%
jan 1, 2008
53.472
+0.634
1.2%
jan 1, 2009
52.75
-0.722
-1.35%
jan 1, 2010
52.695
-0.055
-0.1%
jan 1, 2011
50.998
-1.697
-3.22%
jan 1, 2012
49.175
-1.823
-3.57%
jan 1, 2013
46.977
-2.198
-4.47%
Ranking of countries by current statistics by years


Comments: