29
/
en
AIzaSyAYiBZKx7MnpbEhh9jyipgxe19OcubqV5w
April 1, 2024
287516
Zimbabwe
ZWE
true
2
1
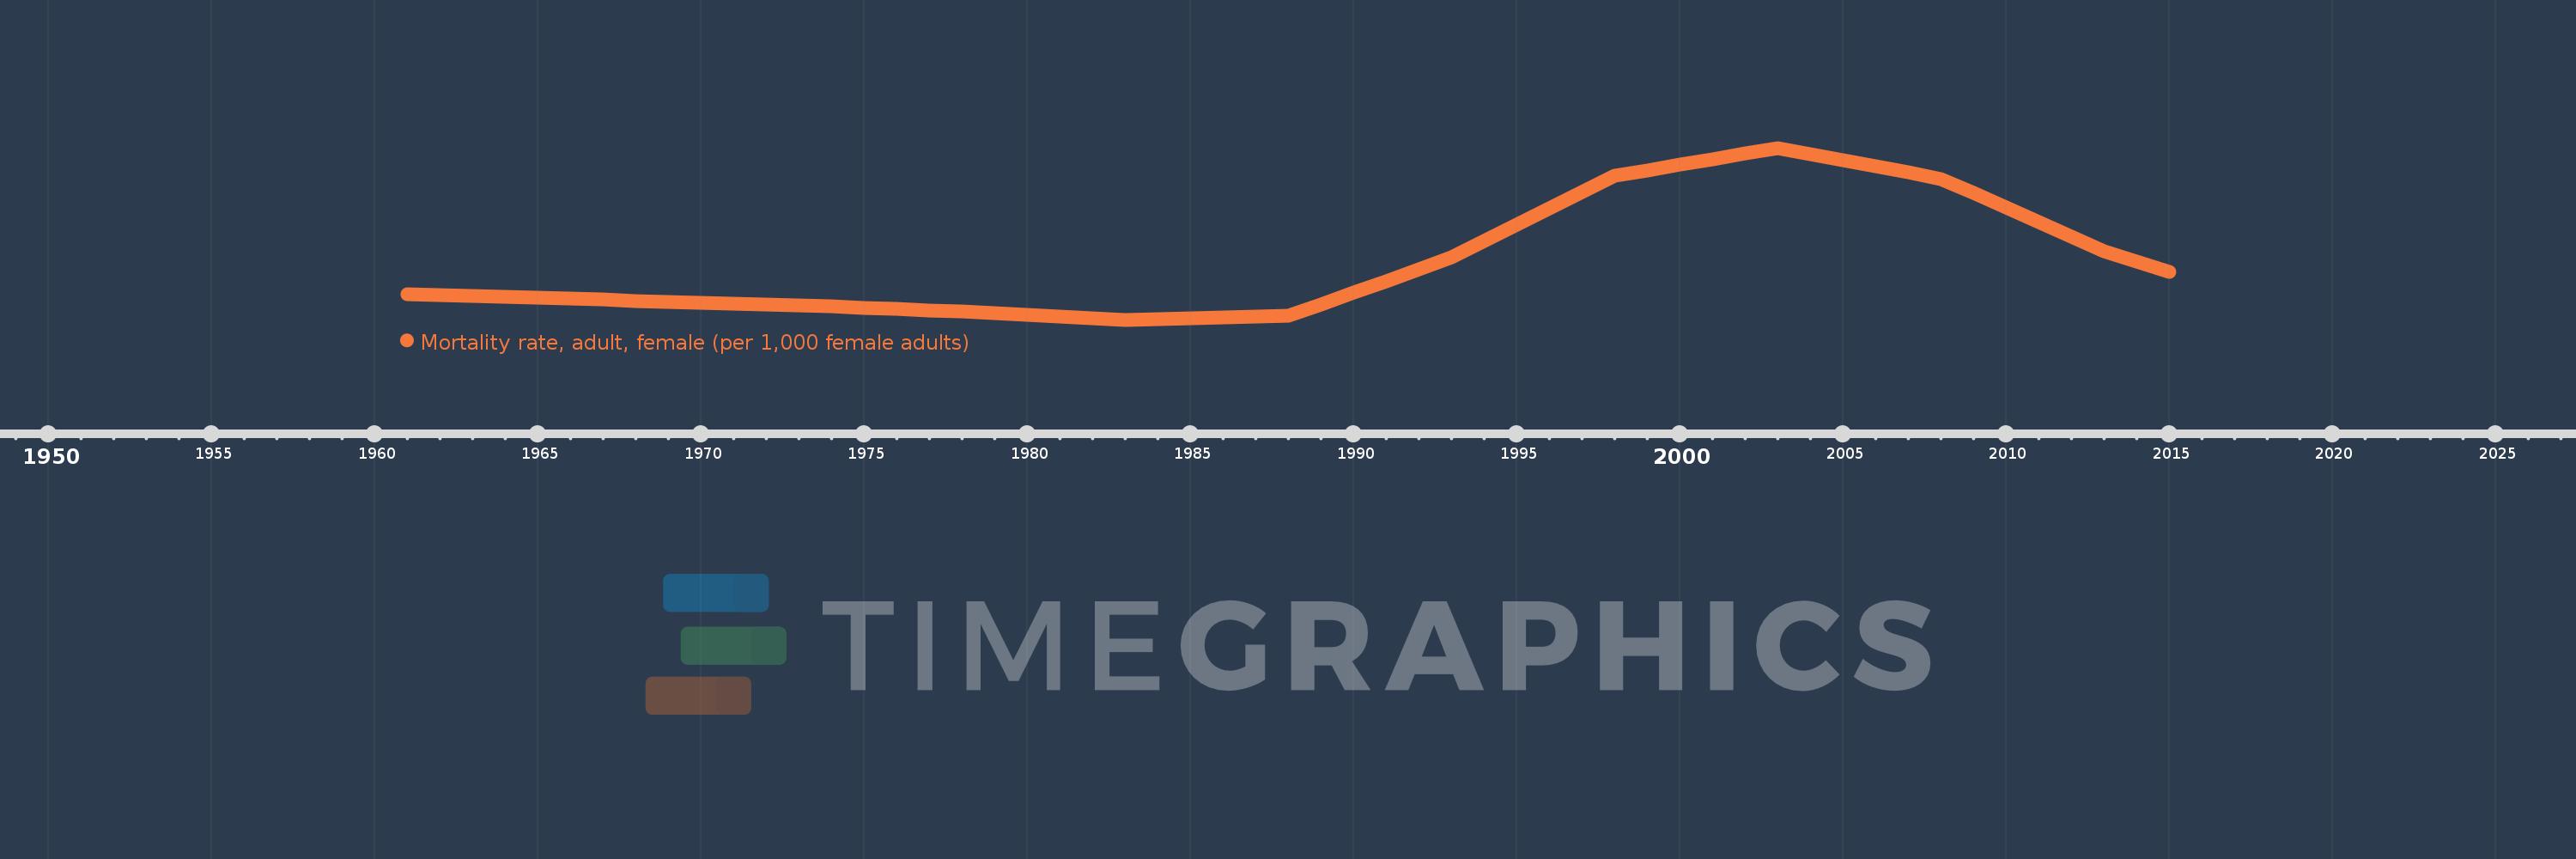
Mortality rate, adult, female (per 1,000 female adults)
2015,2014,2013,2012,2011,2010,2009,2008,2007,2006,2005,2004,2003,2002,2001,2000,1999,1998,1997,1996,1995,1994,1993,1992,1991,1990,1989,1988,1987,1986,1985,1984,1983,1982,1981,1980,1979,1978,1977,1976,1975,1974,1973,1972,1971,1970,1969,1968,1967,1966,1965,1964,1963,1962,1961
This statistics in other country:
AfghanistanAlbaniaAlgeriaAngolaAntigua and BarbudaArab WorldArgentinaArmeniaArubaAustraliaAustriaAzerbaijanBahamas, TheBahrainBangladeshBarbadosBelarusBelgiumBelizeBeninBhutanBoliviaBosnia and HerzegovinaBotswanaBrazilBrunei DarussalamBulgariaBurkina FasoBurundiCabo VerdeCambodiaCameroonCanadaCaribbean small statesCentral African RepublicCentral Europe and the BalticsChadChannel IslandsChileChinaColombiaComorosCongo, Dem. Rep.Congo, Rep.Costa RicaCote d'IvoireCroatiaCubaCuracaoCyprusCzech RepublicDenmarkDjiboutiDominicaDominican RepublicEarly-demographic dividendEast Asia & PacificEast Asia & Pacific (excluding high income)East Asia & Pacific (IDA & IBRD countries)EcuadorEgypt, Arab Rep.El SalvadorEquatorial GuineaEritreaEstoniaEthiopiaEuro areaEurope & Central AsiaEurope & Central Asia (excluding high income)Europe & Central Asia (IDA & IBRD countries)European UnionFijiFinlandFragile and conflict affected situationsFranceFrench PolynesiaGabonGambia, TheGeorgiaGermanyGhanaGreeceGreenlandGrenadaGuamGuatemalaGuineaGuinea-BissauGuyanaHaitiHeavily indebted poor countries (HIPC)High incomeHondurasHong Kong SAR, ChinaHungaryIBRD onlyIcelandIDA & IBRD totalIDA blendIDA onlyIDA totalIndiaIndonesiaIran, Islamic Rep.IraqIrelandIsraelItalyJamaicaJapanJordanKazakhstanKenyaKiribatiKorea, Dem. People’s Rep.Korea, Rep.KuwaitKyrgyz RepublicLao PDRLate-demographic dividendLatin America & Caribbean Latin America & Caribbean (excluding high income)Latin America & the Caribbean (IDA & IBRD countries)LatviaLeast developed countries: UN classificationLebanonLesothoLiberiaLibyaLithuaniaLow & middle incomeLow incomeLower middle incomeLuxembourgMacao SAR, ChinaMacedonia, FYRMadagascarMalawiMalaysiaMaldivesMaliMaltaMarshall IslandsMauritaniaMauritiusMexicoMicronesia, Fed. Sts.Middle East & North AfricaMiddle East & North Africa (excluding high income)Middle East & North Africa (IDA & IBRD countries)Middle incomeMoldovaMongoliaMontenegroMoroccoMozambiqueMyanmarNamibiaNepalNetherlandsNew CaledoniaNew ZealandNicaraguaNigerNigeriaNorth AmericaNorwayOECD membersOmanOther small statesPacific island small statesPakistanPanamaPapua New GuineaParaguayPeruPhilippinesPolandPortugalPost-demographic dividendPre-demographic dividendPuerto RicoQatarRomaniaRussian FederationRwandaSamoaSao Tome and PrincipeSaudi ArabiaSenegalSerbiaSeychellesSierra LeoneSingaporeSlovak RepublicSloveniaSmall statesSolomon IslandsSomaliaSouth AfricaSouth AsiaSouth Asia (IDA & IBRD)South SudanSpainSri LankaSt. Kitts and NevisSt. LuciaSt. Vincent and the GrenadinesSub-Saharan Africa Sub-Saharan Africa (excluding high income)Sub-Saharan Africa (IDA & IBRD countries)SudanSurinameSwazilandSwedenSwitzerlandSyrian Arab RepublicTajikistanTanzaniaThailandTimor-LesteTogoTongaTrinidad and TobagoTunisiaTurkeyTurkmenistanUgandaUkraineUnited Arab EmiratesUnited KingdomUnited StatesUpper middle incomeUruguayUzbekistanVanuatuVenezuela, RBVietnamVirgin Islands (U.S.)West Bank and GazaWorldYemen, Rep.ZambiaZimbabwe Timeline:
This timeline shows a graph from 1961 to 2015 of Zimbabwe. No data until 1960. Number of actual observations by date: 55.
Source name:
World Development Indicators
Source organization:
(1) United Nations Population Division. World Population Prospects. New York, United Nations, Department of Economic and Social Affairs (advanced Excel tables). Available at http://esa.un.org/wpp/unpp/panel_population.htm, (2) University of California, Berkeley, and Max Planck Institute for Demographic Research. Human Mortality Database. [ www.mortality.org or www.humanmortality.de].
Categories, topics:
Health, Gender
Last updated:
apr 23, 2017
Indicators value changes by year
Minimum:
218.985
jan 1, 1983
Maximum:
799.382
jan 1, 2003
At the date of observation
Value
Absolute change
Change from previous value
jan 1, 1961
306.201
+306.201
0.0%
jan 1, 1962
302.669
-3.532
-1.15%
jan 1, 1963
299.137
-3.532
-1.17%
jan 1, 1964
295.957
-3.18
-1.06%
jan 1, 1965
292.778
-3.179
-1.07%
jan 1, 1966
289.598
-3.18
-1.09%
jan 1, 1967
286.418
-3.18
-1.1%
jan 1, 1968
283.239
-3.179
-1.11%
jan 1, 1969
280.043
-3.196
-1.13%
jan 1, 1970
276.848
-3.195
-1.14%
jan 1, 1971
273.653
-3.195
-1.15%
jan 1, 1972
270.458
-3.195
-1.17%
jan 1, 1973
267.263
-3.195
-1.18%
jan 1, 1974
263.308
-3.955
-1.48%
jan 1, 1975
259.352
-3.956
-1.5%
jan 1, 1976
255.396
-3.956
-1.53%
jan 1, 1977
251.441
-3.955
-1.55%
jan 1, 1978
247.485
-3.956
-1.57%
jan 1, 1979
241.785
-5.7
-2.3%
jan 1, 1980
236.085
-5.7
-2.36%
jan 1, 1981
230.385
-5.7
-2.41%
jan 1, 1982
224.685
-5.7
-2.47%
jan 1, 1983
218.985
-5.7
-2.54%
jan 1, 1984
221.623
+2.638
1.2%
jan 1, 1985
224.261
+2.638
1.19%
jan 1, 1986
226.899
+2.638
1.18%
jan 1, 1987
229.537
+2.638
1.16%
jan 1, 1988
232.176
+2.639
1.15%
jan 1, 1989
271.461
+39.285
16.92%
jan 1, 1990
310.746
+39.285
14.47%
jan 1, 1991
350.032
+39.286
12.64%
jan 1, 1992
389.317
+39.285
11.22%
jan 1, 1993
428.602
+39.285
10.09%
jan 1, 1994
483.948
+55.346
12.91%
jan 1, 1995
539.294
+55.346
11.44%
jan 1, 1996
594.639
+55.345
10.26%
jan 1, 1997
649.985
+55.346
9.31%
jan 1, 1998
705.331
+55.346
8.51%
jan 1, 1999
724.141
+18.81
2.67%
jan 1, 2000
742.951
+18.81
2.6%
jan 1, 2001
761.761
+18.81
2.53%
jan 1, 2002
780.571
+18.81
2.47%
jan 1, 2003
799.382
+18.811
2.41%
jan 1, 2004
778.599
-20.783
-2.6%
jan 1, 2005
757.817
-20.782
-2.67%
jan 1, 2006
737.035
-20.782
-2.74%
jan 1, 2007
716.253
-20.782
-2.82%
jan 1, 2008
695.47
-20.783
-2.9%
jan 1, 2009
646.387
-49.083
-7.06%
jan 1, 2010
597.303
-49.084
-7.59%
jan 1, 2011
548.219
-49.084
-8.22%
jan 1, 2012
499.136
-49.083
-8.95%
jan 1, 2013
450.052
-49.084
-9.83%
jan 1, 2014
415.875
-34.177
-7.59%
jan 1, 2015
381.697
-34.178
-8.22%
Ranking of countries by current statistics by years


Comments: