29
/
en
AIzaSyAYiBZKx7MnpbEhh9jyipgxe19OcubqV5w
April 1, 2024
165154
Jordan
JOR
true
2
1
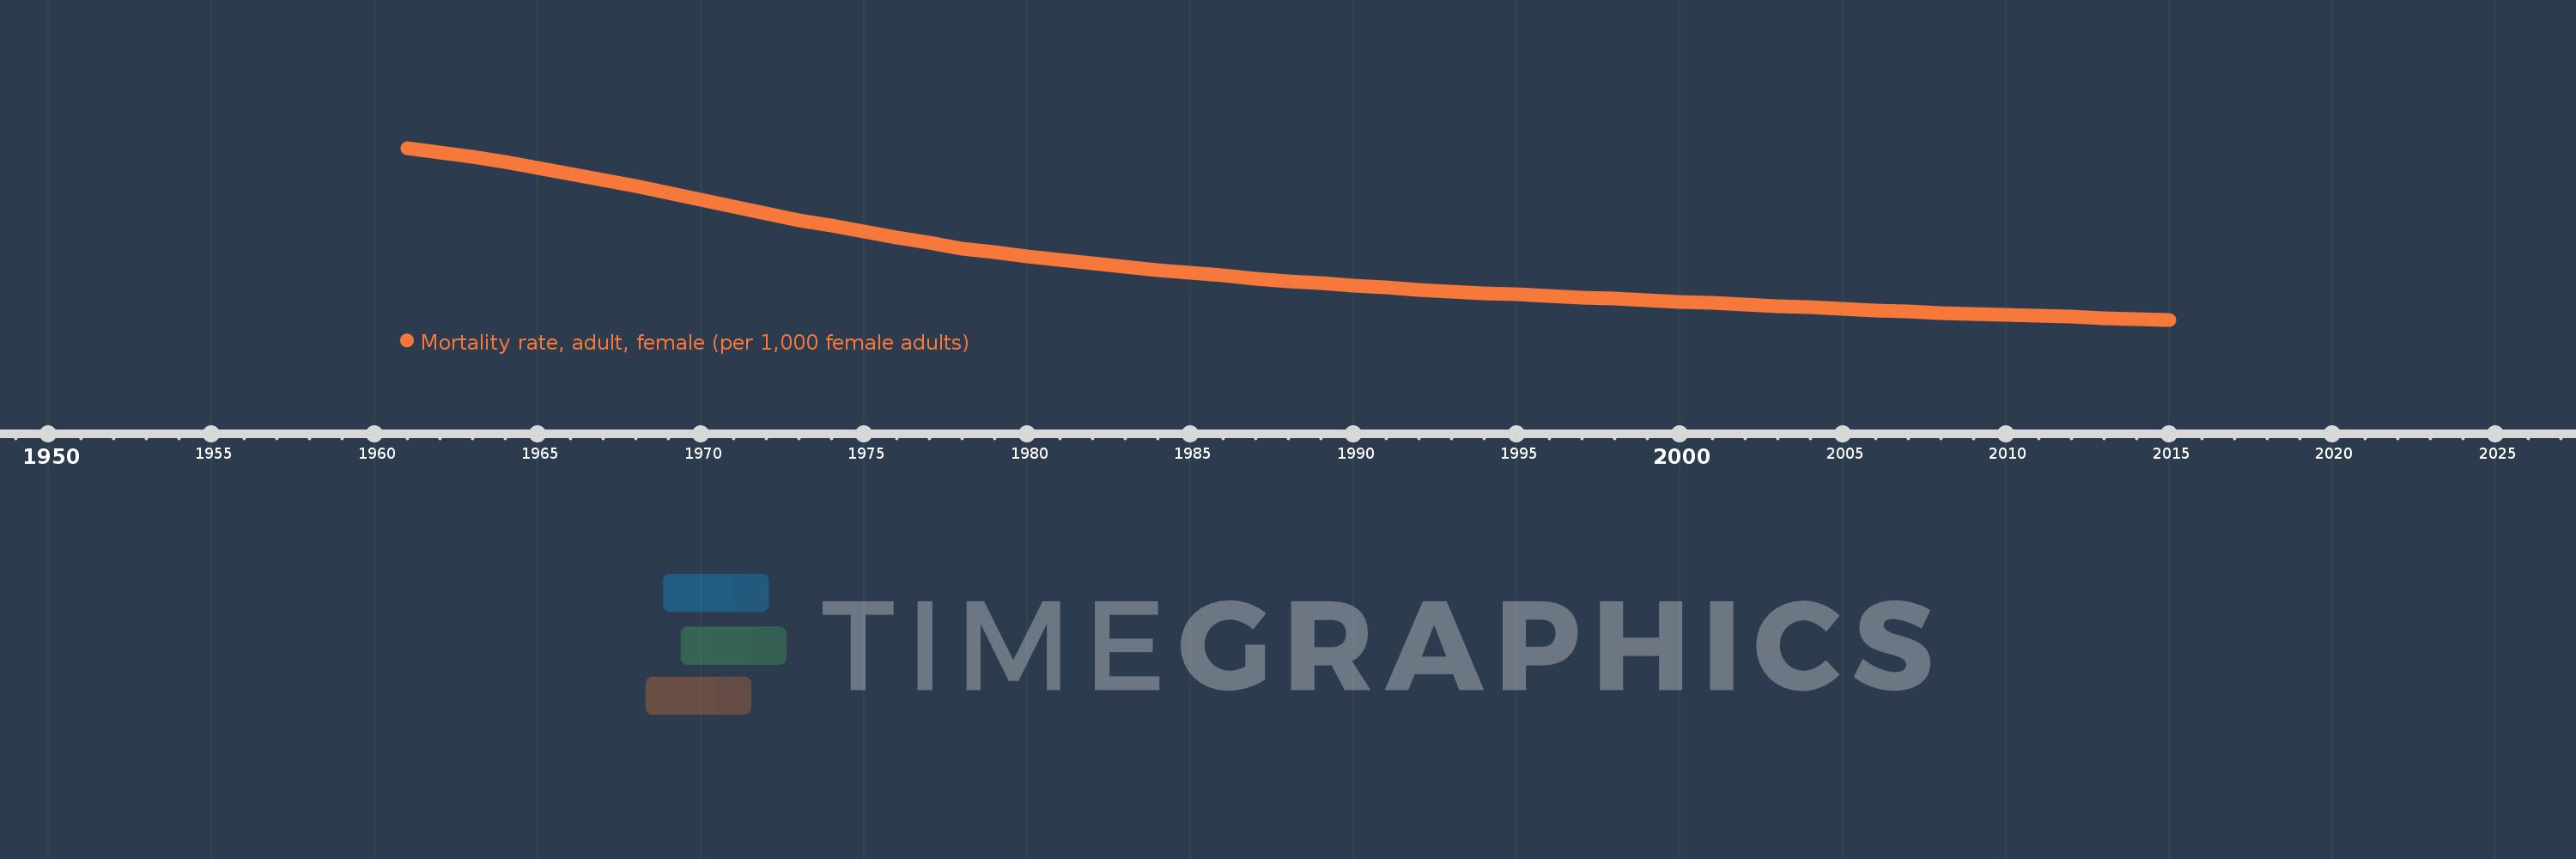
Mortality rate, adult, female (per 1,000 female adults)
2015,2014,2013,2012,2011,2010,2009,2008,2007,2006,2005,2004,2003,2002,2001,2000,1999,1998,1997,1996,1995,1994,1993,1992,1991,1990,1989,1988,1987,1986,1985,1984,1983,1982,1981,1980,1979,1978,1977,1976,1975,1974,1973,1972,1971,1970,1969,1968,1967,1966,1965,1964,1963,1962,1961
This statistics in other country:
AfghanistanAlbaniaAlgeriaAngolaAntigua and BarbudaArab WorldArgentinaArmeniaArubaAustraliaAustriaAzerbaijanBahamas, TheBahrainBangladeshBarbadosBelarusBelgiumBelizeBeninBhutanBoliviaBosnia and HerzegovinaBotswanaBrazilBrunei DarussalamBulgariaBurkina FasoBurundiCabo VerdeCambodiaCameroonCanadaCaribbean small statesCentral African RepublicCentral Europe and the BalticsChadChannel IslandsChileChinaColombiaComorosCongo, Dem. Rep.Congo, Rep.Costa RicaCote d'IvoireCroatiaCubaCuracaoCyprusCzech RepublicDenmarkDjiboutiDominicaDominican RepublicEarly-demographic dividendEast Asia & PacificEast Asia & Pacific (excluding high income)East Asia & Pacific (IDA & IBRD countries)EcuadorEgypt, Arab Rep.El SalvadorEquatorial GuineaEritreaEstoniaEthiopiaEuro areaEurope & Central AsiaEurope & Central Asia (excluding high income)Europe & Central Asia (IDA & IBRD countries)European UnionFijiFinlandFragile and conflict affected situationsFranceFrench PolynesiaGabonGambia, TheGeorgiaGermanyGhanaGreeceGreenlandGrenadaGuamGuatemalaGuineaGuinea-BissauGuyanaHaitiHeavily indebted poor countries (HIPC)High incomeHondurasHong Kong SAR, ChinaHungaryIBRD onlyIcelandIDA & IBRD totalIDA blendIDA onlyIDA totalIndiaIndonesiaIran, Islamic Rep.IraqIrelandIsraelItalyJamaicaJapanJordanKazakhstanKenyaKiribatiKorea, Dem. People’s Rep.Korea, Rep.KuwaitKyrgyz RepublicLao PDRLate-demographic dividendLatin America & Caribbean Latin America & Caribbean (excluding high income)Latin America & the Caribbean (IDA & IBRD countries)LatviaLeast developed countries: UN classificationLebanonLesothoLiberiaLibyaLithuaniaLow & middle incomeLow incomeLower middle incomeLuxembourgMacao SAR, ChinaMacedonia, FYRMadagascarMalawiMalaysiaMaldivesMaliMaltaMarshall IslandsMauritaniaMauritiusMexicoMicronesia, Fed. Sts.Middle East & North AfricaMiddle East & North Africa (excluding high income)Middle East & North Africa (IDA & IBRD countries)Middle incomeMoldovaMongoliaMontenegroMoroccoMozambiqueMyanmarNamibiaNepalNetherlandsNew CaledoniaNew ZealandNicaraguaNigerNigeriaNorth AmericaNorwayOECD membersOmanOther small statesPacific island small statesPakistanPanamaPapua New GuineaParaguayPeruPhilippinesPolandPortugalPost-demographic dividendPre-demographic dividendPuerto RicoQatarRomaniaRussian FederationRwandaSamoaSao Tome and PrincipeSaudi ArabiaSenegalSerbiaSeychellesSierra LeoneSingaporeSlovak RepublicSloveniaSmall statesSolomon IslandsSomaliaSouth AfricaSouth AsiaSouth Asia (IDA & IBRD)South SudanSpainSri LankaSt. Kitts and NevisSt. LuciaSt. Vincent and the GrenadinesSub-Saharan Africa Sub-Saharan Africa (excluding high income)Sub-Saharan Africa (IDA & IBRD countries)SudanSurinameSwazilandSwedenSwitzerlandSyrian Arab RepublicTajikistanTanzaniaThailandTimor-LesteTogoTongaTrinidad and TobagoTunisiaTurkeyTurkmenistanUgandaUkraineUnited Arab EmiratesUnited KingdomUnited StatesUpper middle incomeUruguayUzbekistanVanuatuVenezuela, RBVietnamVirgin Islands (U.S.)West Bank and GazaWorldYemen, Rep.ZambiaZimbabwe Timeline:
This timeline shows a graph from 1961 to 2015 of Jordan. No data until 1960. Number of actual observations by date: 55.
Source name:
World Development Indicators
Source organization:
(1) United Nations Population Division. World Population Prospects. New York, United Nations, Department of Economic and Social Affairs (advanced Excel tables). Available at http://esa.un.org/wpp/unpp/panel_population.htm, (2) University of California, Berkeley, and Max Planck Institute for Demographic Research. Human Mortality Database. [ www.mortality.org or www.humanmortality.de].
Categories, topics:
Health, Gender
Last updated:
apr 23, 2017
Indicators value changes by year
Minimum:
93.627
jan 1, 2015
Maximum:
305.412
jan 1, 1961
At the date of observation
Value
Absolute change
Change from previous value
jan 1, 1961
305.412
+305.412
0.0%
jan 1, 1962
300.216
-5.196
-1.7%
jan 1, 1963
295.02
-5.196
-1.73%
jan 1, 1964
287.641
-7.379
-2.5%
jan 1, 1965
280.261
-7.38
-2.57%
jan 1, 1966
272.882
-7.379
-2.63%
jan 1, 1967
265.503
-7.379
-2.7%
jan 1, 1968
258.124
-7.379
-2.78%
jan 1, 1969
249.772
-8.352
-3.24%
jan 1, 1970
241.42
-8.352
-3.34%
jan 1, 1971
233.068
-8.352
-3.46%
jan 1, 1972
224.715
-8.353
-3.58%
jan 1, 1973
216.363
-8.352
-3.72%
jan 1, 1974
209.318
-7.045
-3.26%
jan 1, 1975
202.272
-7.046
-3.37%
jan 1, 1976
195.227
-7.045
-3.48%
jan 1, 1977
188.181
-7.046
-3.61%
jan 1, 1978
181.136
-7.045
-3.74%
jan 1, 1979
176.622
-4.514
-2.49%
jan 1, 1980
172.108
-4.514
-2.56%
jan 1, 1981
167.594
-4.514
-2.62%
jan 1, 1982
163.08
-4.514
-2.69%
jan 1, 1983
158.566
-4.514
-2.77%
jan 1, 1984
155.062
-3.504
-2.21%
jan 1, 1985
151.558
-3.504
-2.26%
jan 1, 1986
148.054
-3.504
-2.31%
jan 1, 1987
144.55
-3.504
-2.37%
jan 1, 1988
141.046
-3.504
-2.42%
jan 1, 1989
138.407
-2.639
-1.87%
jan 1, 1990
135.767
-2.64
-1.91%
jan 1, 1991
133.128
-2.639
-1.94%
jan 1, 1992
130.489
-2.639
-1.98%
jan 1, 1993
127.85
-2.639
-2.02%
jan 1, 1994
126.211
-1.639
-1.28%
jan 1, 1995
124.571
-1.64
-1.3%
jan 1, 1996
122.931
-1.64
-1.32%
jan 1, 1997
121.292
-1.639
-1.33%
jan 1, 1998
119.652
-1.64
-1.35%
jan 1, 1999
117.789
-1.863
-1.56%
jan 1, 2000
115.926
-1.863
-1.58%
jan 1, 2001
114.063
-1.863
-1.61%
jan 1, 2002
112.201
-1.862
-1.63%
jan 1, 2003
110.338
-1.863
-1.66%
jan 1, 2004
108.701
-1.637
-1.48%
jan 1, 2005
107.065
-1.636
-1.51%
jan 1, 2006
105.429
-1.636
-1.53%
jan 1, 2007
103.793
-1.636
-1.55%
jan 1, 2008
102.156
-1.637
-1.58%
jan 1, 2009
100.904
-1.252
-1.23%
jan 1, 2010
99.652
-1.252
-1.24%
jan 1, 2011
98.4
-1.252
-1.26%
jan 1, 2012
97.148
-1.252
-1.27%
jan 1, 2013
95.895
-1.253
-1.29%
jan 1, 2014
94.761
-1.134
-1.18%
jan 1, 2015
93.627
-1.134
-1.2%
Ranking of countries by current statistics by years


Comments: