29
/
en
AIzaSyAYiBZKx7MnpbEhh9jyipgxe19OcubqV5w
April 1, 2024
42651
Latin America & Caribbean (excluding high income)
LAC
false
2
1
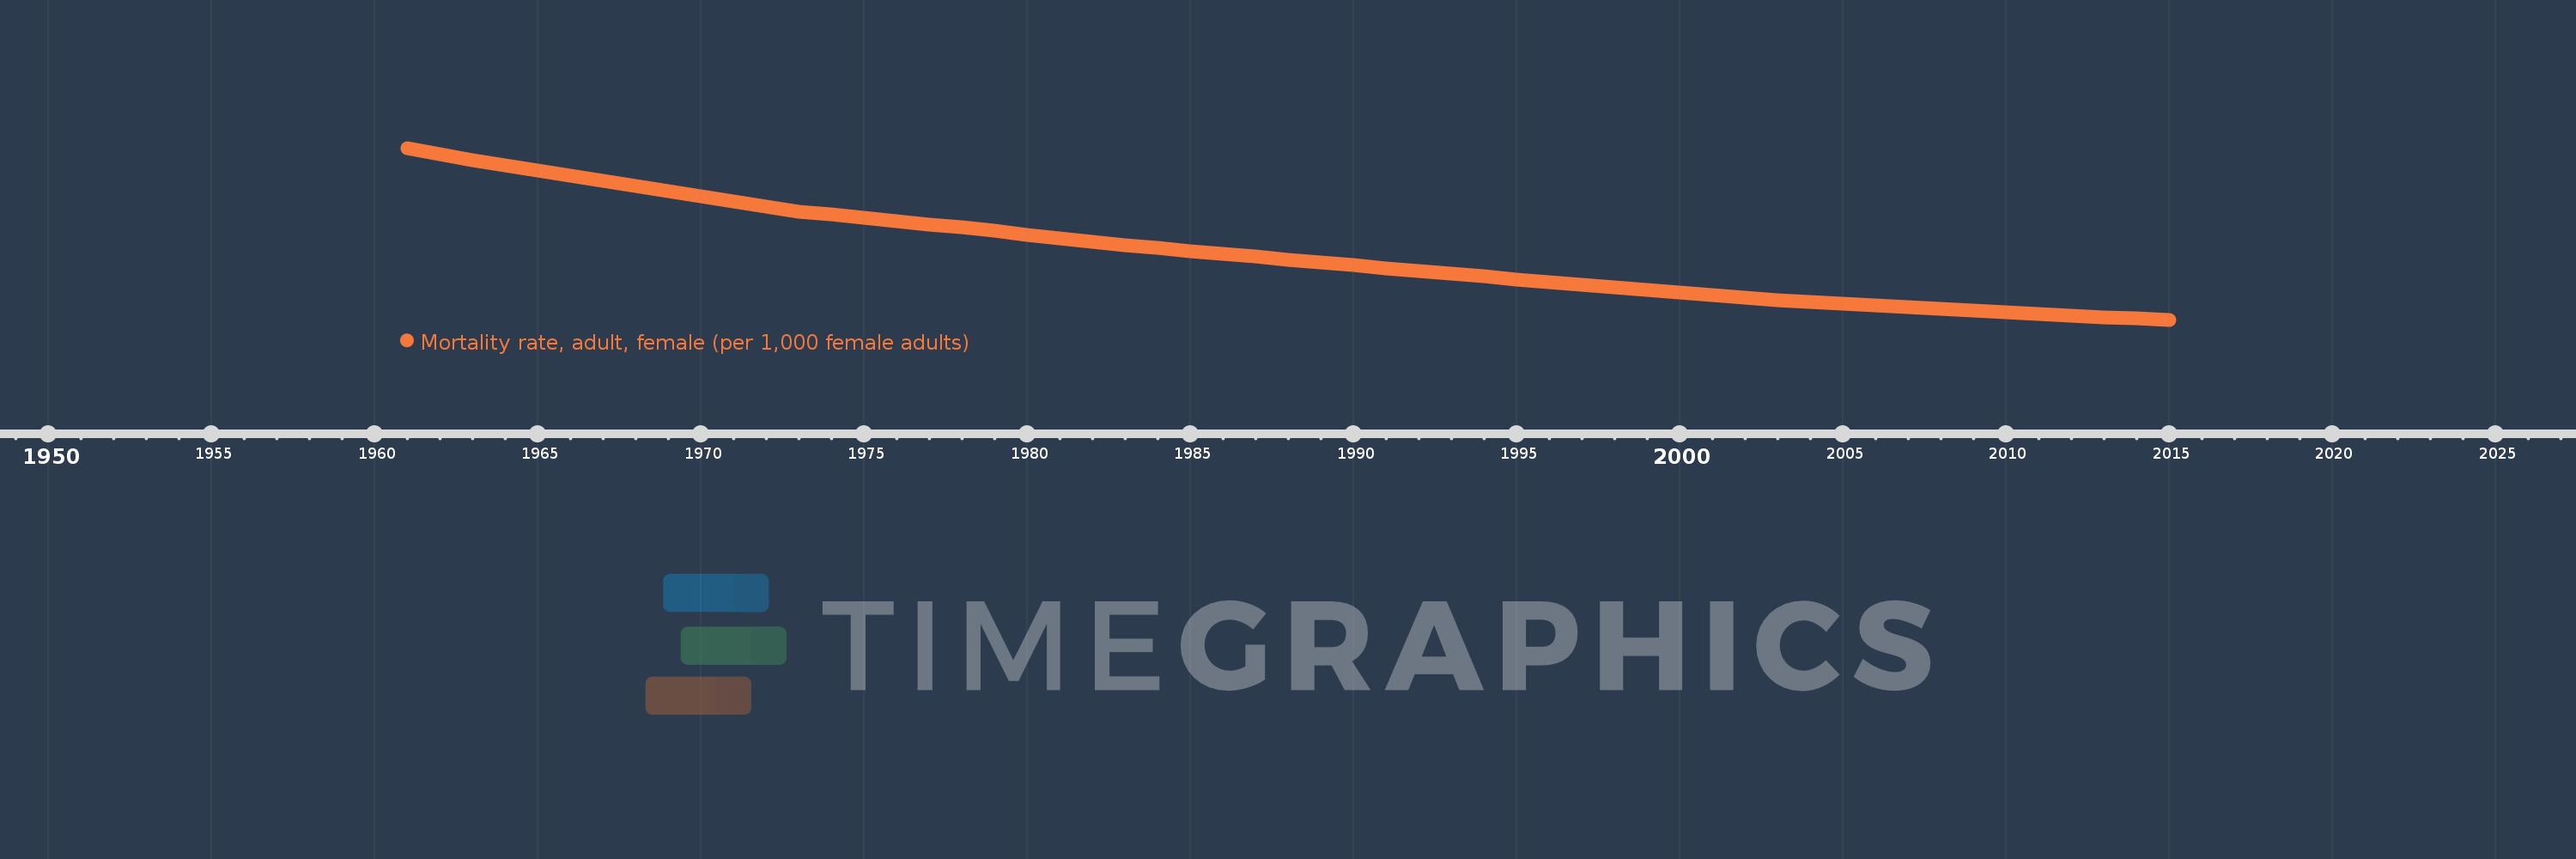
Mortality rate, adult, female (per 1,000 female adults)
2015,2014,2013,2012,2011,2010,2009,2008,2007,2006,2005,2004,2003,2002,2001,2000,1999,1998,1997,1996,1995,1994,1993,1992,1991,1990,1989,1988,1987,1986,1985,1984,1983,1982,1981,1980,1979,1978,1977,1976,1975,1974,1973,1972,1971,1970,1969,1968,1967,1966,1965,1964,1963,1962,1961
This statistics in other country:
AfghanistanAlbaniaAlgeriaAngolaAntigua and BarbudaArab WorldArgentinaArmeniaArubaAustraliaAustriaAzerbaijanBahamas, TheBahrainBangladeshBarbadosBelarusBelgiumBelizeBeninBhutanBoliviaBosnia and HerzegovinaBotswanaBrazilBrunei DarussalamBulgariaBurkina FasoBurundiCabo VerdeCambodiaCameroonCanadaCaribbean small statesCentral African RepublicCentral Europe and the BalticsChadChannel IslandsChileChinaColombiaComorosCongo, Dem. Rep.Congo, Rep.Costa RicaCote d'IvoireCroatiaCubaCuracaoCyprusCzech RepublicDenmarkDjiboutiDominicaDominican RepublicEarly-demographic dividendEast Asia & PacificEast Asia & Pacific (excluding high income)East Asia & Pacific (IDA & IBRD countries)EcuadorEgypt, Arab Rep.El SalvadorEquatorial GuineaEritreaEstoniaEthiopiaEuro areaEurope & Central AsiaEurope & Central Asia (excluding high income)Europe & Central Asia (IDA & IBRD countries)European UnionFijiFinlandFragile and conflict affected situationsFranceFrench PolynesiaGabonGambia, TheGeorgiaGermanyGhanaGreeceGreenlandGrenadaGuamGuatemalaGuineaGuinea-BissauGuyanaHaitiHeavily indebted poor countries (HIPC)High incomeHondurasHong Kong SAR, ChinaHungaryIBRD onlyIcelandIDA & IBRD totalIDA blendIDA onlyIDA totalIndiaIndonesiaIran, Islamic Rep.IraqIrelandIsraelItalyJamaicaJapanJordanKazakhstanKenyaKiribatiKorea, Dem. People’s Rep.Korea, Rep.KuwaitKyrgyz RepublicLao PDRLate-demographic dividendLatin America & Caribbean Latin America & Caribbean (excluding high income)Latin America & the Caribbean (IDA & IBRD countries)LatviaLeast developed countries: UN classificationLebanonLesothoLiberiaLibyaLithuaniaLow & middle incomeLow incomeLower middle incomeLuxembourgMacao SAR, ChinaMacedonia, FYRMadagascarMalawiMalaysiaMaldivesMaliMaltaMarshall IslandsMauritaniaMauritiusMexicoMicronesia, Fed. Sts.Middle East & North AfricaMiddle East & North Africa (excluding high income)Middle East & North Africa (IDA & IBRD countries)Middle incomeMoldovaMongoliaMontenegroMoroccoMozambiqueMyanmarNamibiaNepalNetherlandsNew CaledoniaNew ZealandNicaraguaNigerNigeriaNorth AmericaNorwayOECD membersOmanOther small statesPacific island small statesPakistanPanamaPapua New GuineaParaguayPeruPhilippinesPolandPortugalPost-demographic dividendPre-demographic dividendPuerto RicoQatarRomaniaRussian FederationRwandaSamoaSao Tome and PrincipeSaudi ArabiaSenegalSerbiaSeychellesSierra LeoneSingaporeSlovak RepublicSloveniaSmall statesSolomon IslandsSomaliaSouth AfricaSouth AsiaSouth Asia (IDA & IBRD)South SudanSpainSri LankaSt. Kitts and NevisSt. LuciaSt. Vincent and the GrenadinesSub-Saharan Africa Sub-Saharan Africa (excluding high income)Sub-Saharan Africa (IDA & IBRD countries)SudanSurinameSwazilandSwedenSwitzerlandSyrian Arab RepublicTajikistanTanzaniaThailandTimor-LesteTogoTongaTrinidad and TobagoTunisiaTurkeyTurkmenistanUgandaUkraineUnited Arab EmiratesUnited KingdomUnited StatesUpper middle incomeUruguayUzbekistanVanuatuVenezuela, RBVietnamVirgin Islands (U.S.)West Bank and GazaWorldYemen, Rep.ZambiaZimbabwe Timeline:
This timeline shows a graph from 1961 to 2015 of Latin America & Caribbean (excluding high income). No data until 1960. Number of actual observations by date: 55.
Source name:
World Development Indicators
Source organization:
(1) United Nations Population Division. World Population Prospects. New York, United Nations, Department of Economic and Social Affairs (advanced Excel tables). Available at http://esa.un.org/wpp/unpp/panel_population.htm, (2) University of California, Berkeley, and Max Planck Institute for Demographic Research. Human Mortality Database. [ www.mortality.org or www.humanmortality.de].
Categories, topics:
Health, Gender
Last updated:
apr 23, 2017
Indicators value changes by year
Minimum:
93.761
jan 1, 2015
Maximum:
260.286
jan 1, 1961
At the date of observation
Value
Absolute change
Change from previous value
jan 1, 1961
260.286
+260.286
0.0%
jan 1, 1962
254.19
-6.096
-2.34%
jan 1, 1963
248.112
-6.078
-2.39%
jan 1, 1964
243.132
-4.98
-2.01%
jan 1, 1965
238.157
-4.975
-2.05%
jan 1, 1966
233.188
-4.969
-2.09%
jan 1, 1967
228.198
-4.99
-2.14%
jan 1, 1968
223.212
-4.987
-2.19%
jan 1, 1969
218.351
-4.861
-2.18%
jan 1, 1970
213.483
-4.867
-2.23%
jan 1, 1971
208.607
-4.876
-2.28%
jan 1, 1972
203.667
-4.94
-2.37%
jan 1, 1973
198.728
-4.939
-2.42%
jan 1, 1974
195.622
-3.106
-1.56%
jan 1, 1975
192.509
-3.113
-1.59%
jan 1, 1976
189.386
-3.123
-1.62%
jan 1, 1977
186.246
-3.14
-1.66%
jan 1, 1978
183.099
-3.147
-1.69%
jan 1, 1979
179.725
-3.374
-1.84%
jan 1, 1980
176.35
-3.375
-1.88%
jan 1, 1981
172.971
-3.379
-1.92%
jan 1, 1982
169.557
-3.414
-1.97%
jan 1, 1983
166.137
-3.42
-2.02%
jan 1, 1984
163.318
-2.819
-1.7%
jan 1, 1985
160.491
-2.827
-1.73%
jan 1, 1986
157.656
-2.835
-1.77%
jan 1, 1987
154.787
-2.869
-1.82%
jan 1, 1988
151.921
-2.866
-1.85%
jan 1, 1989
149.211
-2.71
-1.78%
jan 1, 1990
146.5
-2.712
-1.82%
jan 1, 1991
143.788
-2.711
-1.85%
jan 1, 1992
141.089
-2.699
-1.88%
jan 1, 1993
138.38
-2.709
-1.92%
jan 1, 1994
135.667
-2.714
-1.96%
jan 1, 1995
132.965
-2.701
-1.99%
jan 1, 1996
130.279
-2.686
-2.02%
jan 1, 1997
127.598
-2.682
-2.06%
jan 1, 1998
124.926
-2.672
-2.09%
jan 1, 1999
122.496
-2.429
-1.94%
jan 1, 2000
120.063
-2.434
-1.99%
jan 1, 2001
117.623
-2.44
-2.03%
jan 1, 2002
115.174
-2.449
-2.08%
jan 1, 2003
112.726
-2.447
-2.12%
jan 1, 2004
111.016
-1.71
-1.52%
jan 1, 2005
109.303
-1.713
-1.54%
jan 1, 2006
107.587
-1.716
-1.57%
jan 1, 2007
105.862
-1.725
-1.6%
jan 1, 2008
104.136
-1.726
-1.63%
jan 1, 2009
102.577
-1.559
-1.5%
jan 1, 2010
101.019
-1.558
-1.52%
jan 1, 2011
99.464
-1.555
-1.54%
jan 1, 2012
97.911
-1.554
-1.56%
jan 1, 2013
96.36
-1.55
-1.58%
jan 1, 2014
95.061
-1.3
-1.35%
jan 1, 2015
93.761
-1.299
-1.37%
Ranking of countries by current statistics by years


Comments: