29
/
en
AIzaSyAYiBZKx7MnpbEhh9jyipgxe19OcubqV5w
April 1, 2024
233841
Sao Tome and Principe
STP
true
2
1
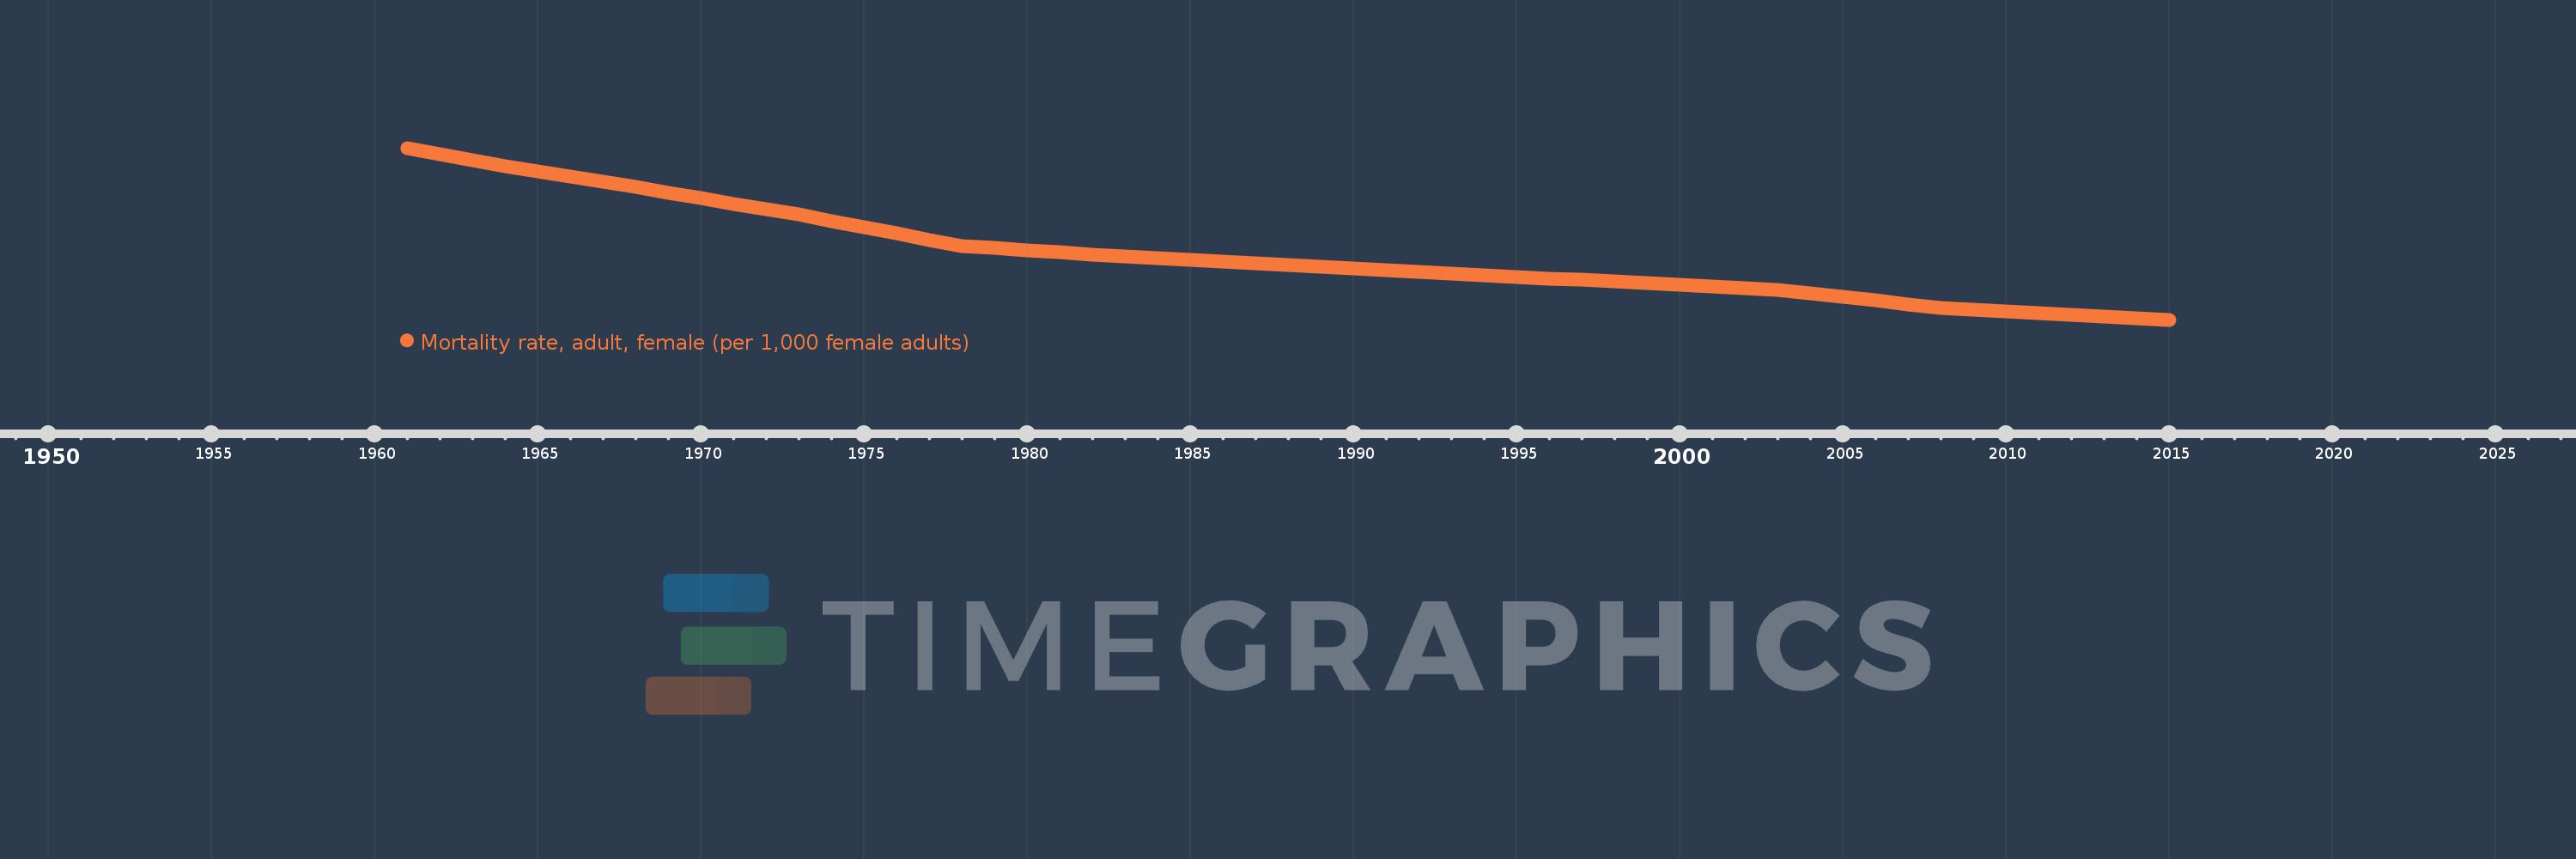
Mortality rate, adult, female (per 1,000 female adults)
2015,2014,2013,2012,2011,2010,2009,2008,2007,2006,2005,2004,2003,2002,2001,2000,1999,1998,1997,1996,1995,1994,1993,1992,1991,1990,1989,1988,1987,1986,1985,1984,1983,1982,1981,1980,1979,1978,1977,1976,1975,1974,1973,1972,1971,1970,1969,1968,1967,1966,1965,1964,1963,1962,1961
This statistics in other country:
AfghanistanAlbaniaAlgeriaAngolaAntigua and BarbudaArab WorldArgentinaArmeniaArubaAustraliaAustriaAzerbaijanBahamas, TheBahrainBangladeshBarbadosBelarusBelgiumBelizeBeninBhutanBoliviaBosnia and HerzegovinaBotswanaBrazilBrunei DarussalamBulgariaBurkina FasoBurundiCabo VerdeCambodiaCameroonCanadaCaribbean small statesCentral African RepublicCentral Europe and the BalticsChadChannel IslandsChileChinaColombiaComorosCongo, Dem. Rep.Congo, Rep.Costa RicaCote d'IvoireCroatiaCubaCuracaoCyprusCzech RepublicDenmarkDjiboutiDominicaDominican RepublicEarly-demographic dividendEast Asia & PacificEast Asia & Pacific (excluding high income)East Asia & Pacific (IDA & IBRD countries)EcuadorEgypt, Arab Rep.El SalvadorEquatorial GuineaEritreaEstoniaEthiopiaEuro areaEurope & Central AsiaEurope & Central Asia (excluding high income)Europe & Central Asia (IDA & IBRD countries)European UnionFijiFinlandFragile and conflict affected situationsFranceFrench PolynesiaGabonGambia, TheGeorgiaGermanyGhanaGreeceGreenlandGrenadaGuamGuatemalaGuineaGuinea-BissauGuyanaHaitiHeavily indebted poor countries (HIPC)High incomeHondurasHong Kong SAR, ChinaHungaryIBRD onlyIcelandIDA & IBRD totalIDA blendIDA onlyIDA totalIndiaIndonesiaIran, Islamic Rep.IraqIrelandIsraelItalyJamaicaJapanJordanKazakhstanKenyaKiribatiKorea, Dem. People’s Rep.Korea, Rep.KuwaitKyrgyz RepublicLao PDRLate-demographic dividendLatin America & Caribbean Latin America & Caribbean (excluding high income)Latin America & the Caribbean (IDA & IBRD countries)LatviaLeast developed countries: UN classificationLebanonLesothoLiberiaLibyaLithuaniaLow & middle incomeLow incomeLower middle incomeLuxembourgMacao SAR, ChinaMacedonia, FYRMadagascarMalawiMalaysiaMaldivesMaliMaltaMarshall IslandsMauritaniaMauritiusMexicoMicronesia, Fed. Sts.Middle East & North AfricaMiddle East & North Africa (excluding high income)Middle East & North Africa (IDA & IBRD countries)Middle incomeMoldovaMongoliaMontenegroMoroccoMozambiqueMyanmarNamibiaNepalNetherlandsNew CaledoniaNew ZealandNicaraguaNigerNigeriaNorth AmericaNorwayOECD membersOmanOther small statesPacific island small statesPakistanPanamaPapua New GuineaParaguayPeruPhilippinesPolandPortugalPost-demographic dividendPre-demographic dividendPuerto RicoQatarRomaniaRussian FederationRwandaSamoaSao Tome and PrincipeSaudi ArabiaSenegalSerbiaSeychellesSierra LeoneSingaporeSlovak RepublicSloveniaSmall statesSolomon IslandsSomaliaSouth AfricaSouth AsiaSouth Asia (IDA & IBRD)South SudanSpainSri LankaSt. Kitts and NevisSt. LuciaSt. Vincent and the GrenadinesSub-Saharan Africa Sub-Saharan Africa (excluding high income)Sub-Saharan Africa (IDA & IBRD countries)SudanSurinameSwazilandSwedenSwitzerlandSyrian Arab RepublicTajikistanTanzaniaThailandTimor-LesteTogoTongaTrinidad and TobagoTunisiaTurkeyTurkmenistanUgandaUkraineUnited Arab EmiratesUnited KingdomUnited StatesUpper middle incomeUruguayUzbekistanVanuatuVenezuela, RBVietnamVirgin Islands (U.S.)West Bank and GazaWorldYemen, Rep.ZambiaZimbabwe Timeline:
This timeline shows a graph from 1961 to 2015 of Sao Tome and Principe. No data until 1960. Number of actual observations by date: 55.
Source name:
World Development Indicators
Source organization:
(1) United Nations Population Division. World Population Prospects. New York, United Nations, Department of Economic and Social Affairs (advanced Excel tables). Available at http://esa.un.org/wpp/unpp/panel_population.htm, (2) University of California, Berkeley, and Max Planck Institute for Demographic Research. Human Mortality Database. [ www.mortality.org or www.humanmortality.de].
Categories, topics:
Health, Gender
Last updated:
apr 23, 2017
Indicators value changes by year
Minimum:
165.159
jan 1, 2015
Maximum:
316.079
jan 1, 1961
At the date of observation
Value
Absolute change
Change from previous value
jan 1, 1961
316.079
+316.079
0.0%
jan 1, 1962
310.541
-5.538
-1.75%
jan 1, 1963
305.004
-5.537
-1.78%
jan 1, 1964
300.316
-4.688
-1.54%
jan 1, 1965
295.629
-4.687
-1.56%
jan 1, 1966
290.941
-4.688
-1.59%
jan 1, 1967
286.254
-4.687
-1.61%
jan 1, 1968
281.567
-4.687
-1.64%
jan 1, 1969
276.75
-4.817
-1.71%
jan 1, 1970
271.934
-4.816
-1.74%
jan 1, 1971
267.118
-4.816
-1.77%
jan 1, 1972
262.302
-4.816
-1.8%
jan 1, 1973
257.485
-4.817
-1.84%
jan 1, 1974
251.948
-5.537
-2.15%
jan 1, 1975
246.411
-5.537
-2.2%
jan 1, 1976
240.874
-5.537
-2.25%
jan 1, 1977
235.336
-5.538
-2.3%
jan 1, 1978
229.799
-5.537
-2.35%
jan 1, 1979
228.006
-1.793
-0.78%
jan 1, 1980
226.213
-1.793
-0.79%
jan 1, 1981
224.42
-1.793
-0.79%
jan 1, 1982
222.627
-1.793
-0.8%
jan 1, 1983
220.834
-1.793
-0.81%
jan 1, 1984
219.338
-1.496
-0.68%
jan 1, 1985
217.843
-1.495
-0.68%
jan 1, 1986
216.347
-1.496
-0.69%
jan 1, 1987
214.851
-1.496
-0.69%
jan 1, 1988
213.356
-1.495
-0.7%
jan 1, 1989
211.866
-1.49
-0.7%
jan 1, 1990
210.377
-1.489
-0.7%
jan 1, 1991
208.888
-1.489
-0.71%
jan 1, 1992
207.398
-1.49
-0.71%
jan 1, 1993
205.909
-1.489
-0.72%
jan 1, 1994
204.449
-1.46
-0.71%
jan 1, 1995
202.988
-1.461
-0.71%
jan 1, 1996
201.528
-1.46
-0.72%
jan 1, 1997
200.068
-1.46
-0.72%
jan 1, 1998
198.608
-1.46
-0.73%
jan 1, 1999
197.195
-1.413
-0.71%
jan 1, 2000
195.783
-1.412
-0.72%
jan 1, 2001
194.371
-1.412
-0.72%
jan 1, 2002
192.959
-1.412
-0.73%
jan 1, 2003
191.546
-1.413
-0.73%
jan 1, 2004
188.341
-3.205
-1.67%
jan 1, 2005
185.135
-3.206
-1.7%
jan 1, 2006
181.929
-3.206
-1.73%
jan 1, 2007
178.724
-3.205
-1.76%
jan 1, 2008
175.518
-3.206
-1.79%
jan 1, 2009
174.007
-1.511
-0.86%
jan 1, 2010
172.496
-1.511
-0.87%
jan 1, 2011
170.985
-1.511
-0.88%
jan 1, 2012
169.474
-1.511
-0.88%
jan 1, 2013
167.963
-1.511
-0.89%
jan 1, 2014
166.561
-1.402
-0.83%
jan 1, 2015
165.159
-1.402
-0.84%
Ranking of countries by current statistics by years


Comments: