29
/
en
AIzaSyAYiBZKx7MnpbEhh9jyipgxe19OcubqV5w
April 1, 2024
154929
India
IND
true
2
1
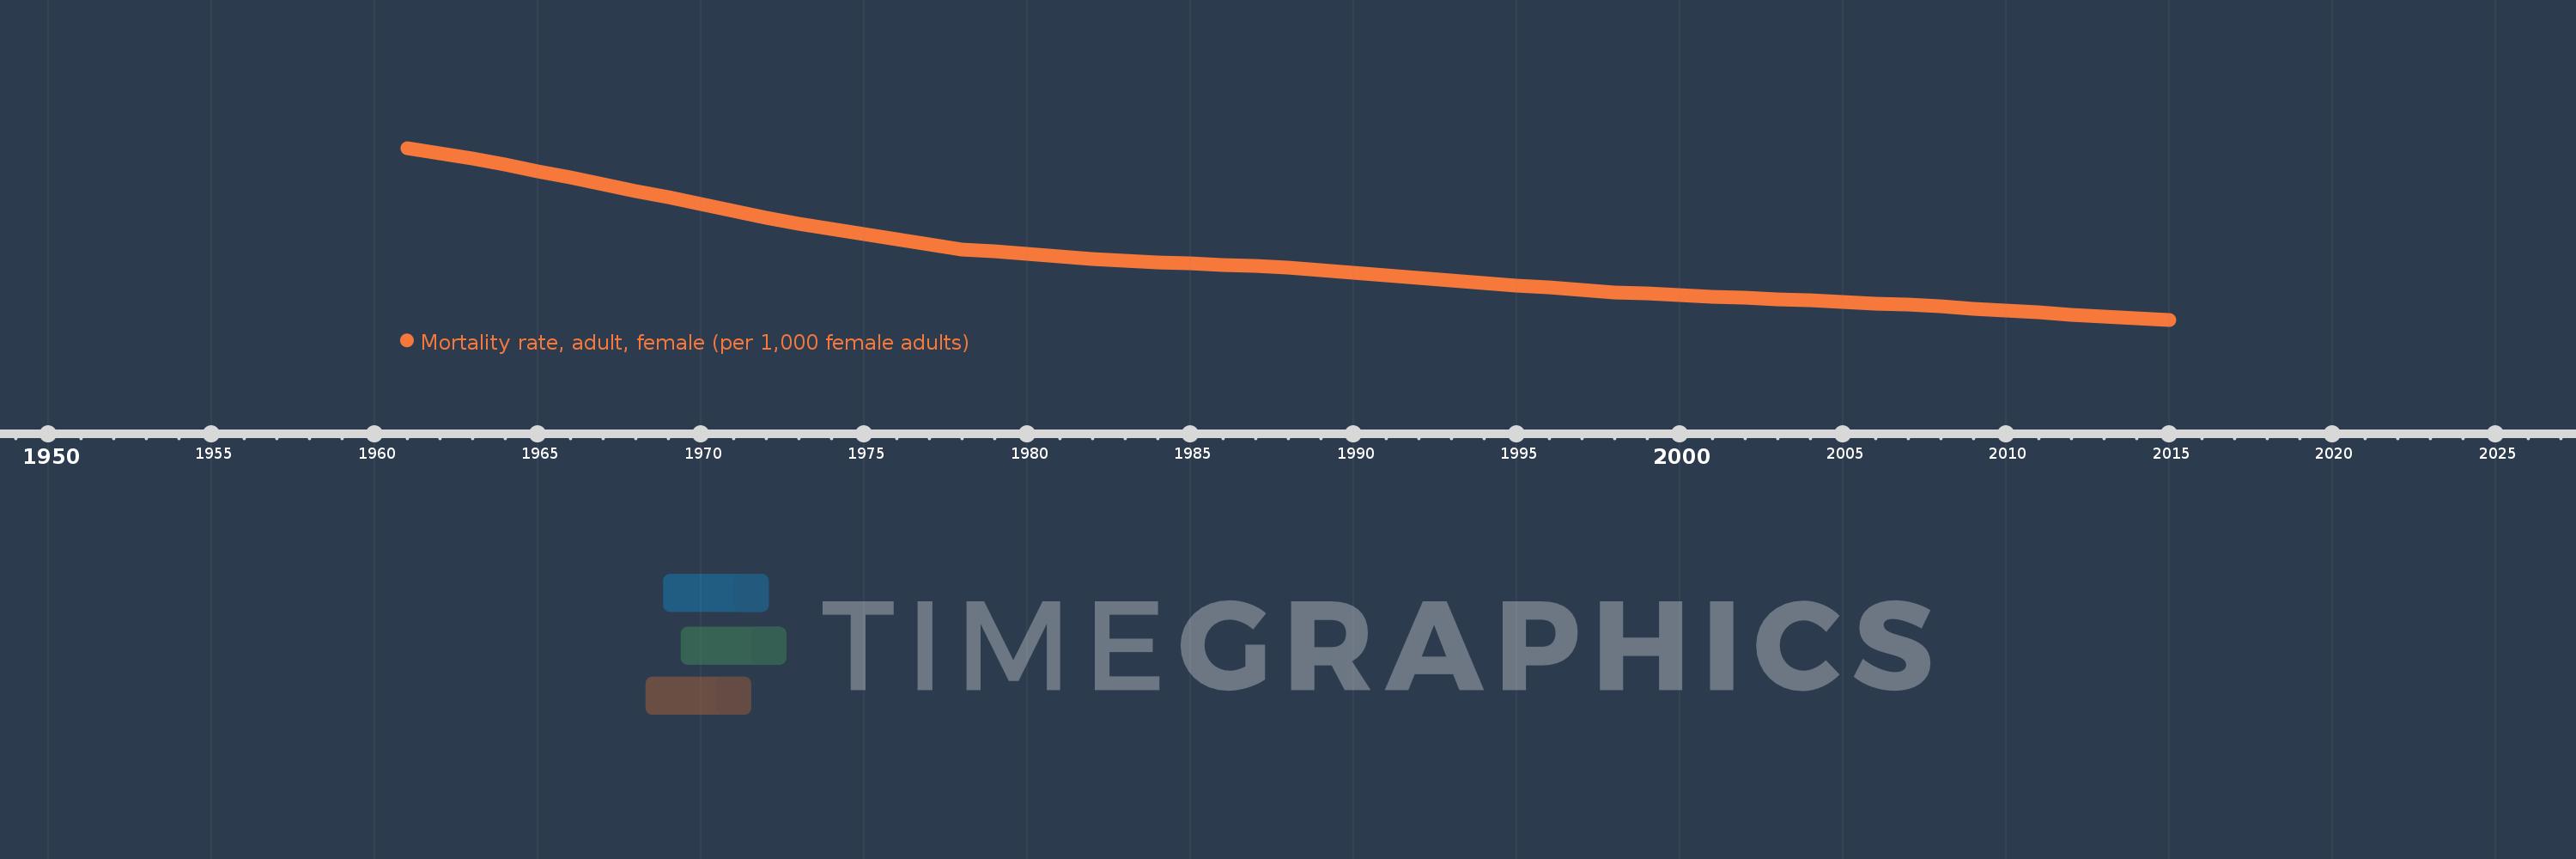
Mortality rate, adult, female (per 1,000 female adults)
2015,2014,2013,2012,2011,2010,2009,2008,2007,2006,2005,2004,2003,2002,2001,2000,1999,1998,1997,1996,1995,1994,1993,1992,1991,1990,1989,1988,1987,1986,1985,1984,1983,1982,1981,1980,1979,1978,1977,1976,1975,1974,1973,1972,1971,1970,1969,1968,1967,1966,1965,1964,1963,1962,1961
This statistics in other country:
AfghanistanAlbaniaAlgeriaAngolaAntigua and BarbudaArab WorldArgentinaArmeniaArubaAustraliaAustriaAzerbaijanBahamas, TheBahrainBangladeshBarbadosBelarusBelgiumBelizeBeninBhutanBoliviaBosnia and HerzegovinaBotswanaBrazilBrunei DarussalamBulgariaBurkina FasoBurundiCabo VerdeCambodiaCameroonCanadaCaribbean small statesCentral African RepublicCentral Europe and the BalticsChadChannel IslandsChileChinaColombiaComorosCongo, Dem. Rep.Congo, Rep.Costa RicaCote d'IvoireCroatiaCubaCuracaoCyprusCzech RepublicDenmarkDjiboutiDominicaDominican RepublicEarly-demographic dividendEast Asia & PacificEast Asia & Pacific (excluding high income)East Asia & Pacific (IDA & IBRD countries)EcuadorEgypt, Arab Rep.El SalvadorEquatorial GuineaEritreaEstoniaEthiopiaEuro areaEurope & Central AsiaEurope & Central Asia (excluding high income)Europe & Central Asia (IDA & IBRD countries)European UnionFijiFinlandFragile and conflict affected situationsFranceFrench PolynesiaGabonGambia, TheGeorgiaGermanyGhanaGreeceGreenlandGrenadaGuamGuatemalaGuineaGuinea-BissauGuyanaHaitiHeavily indebted poor countries (HIPC)High incomeHondurasHong Kong SAR, ChinaHungaryIBRD onlyIcelandIDA & IBRD totalIDA blendIDA onlyIDA totalIndiaIndonesiaIran, Islamic Rep.IraqIrelandIsraelItalyJamaicaJapanJordanKazakhstanKenyaKiribatiKorea, Dem. People’s Rep.Korea, Rep.KuwaitKyrgyz RepublicLao PDRLate-demographic dividendLatin America & Caribbean Latin America & Caribbean (excluding high income)Latin America & the Caribbean (IDA & IBRD countries)LatviaLeast developed countries: UN classificationLebanonLesothoLiberiaLibyaLithuaniaLow & middle incomeLow incomeLower middle incomeLuxembourgMacao SAR, ChinaMacedonia, FYRMadagascarMalawiMalaysiaMaldivesMaliMaltaMarshall IslandsMauritaniaMauritiusMexicoMicronesia, Fed. Sts.Middle East & North AfricaMiddle East & North Africa (excluding high income)Middle East & North Africa (IDA & IBRD countries)Middle incomeMoldovaMongoliaMontenegroMoroccoMozambiqueMyanmarNamibiaNepalNetherlandsNew CaledoniaNew ZealandNicaraguaNigerNigeriaNorth AmericaNorwayOECD membersOmanOther small statesPacific island small statesPakistanPanamaPapua New GuineaParaguayPeruPhilippinesPolandPortugalPost-demographic dividendPre-demographic dividendPuerto RicoQatarRomaniaRussian FederationRwandaSamoaSao Tome and PrincipeSaudi ArabiaSenegalSerbiaSeychellesSierra LeoneSingaporeSlovak RepublicSloveniaSmall statesSolomon IslandsSomaliaSouth AfricaSouth AsiaSouth Asia (IDA & IBRD)South SudanSpainSri LankaSt. Kitts and NevisSt. LuciaSt. Vincent and the GrenadinesSub-Saharan Africa Sub-Saharan Africa (excluding high income)Sub-Saharan Africa (IDA & IBRD countries)SudanSurinameSwazilandSwedenSwitzerlandSyrian Arab RepublicTajikistanTanzaniaThailandTimor-LesteTogoTongaTrinidad and TobagoTunisiaTurkeyTurkmenistanUgandaUkraineUnited Arab EmiratesUnited KingdomUnited StatesUpper middle incomeUruguayUzbekistanVanuatuVenezuela, RBVietnamVirgin Islands (U.S.)West Bank and GazaWorldYemen, Rep.ZambiaZimbabwe Timeline:
This timeline shows a graph from 1961 to 2015 of India. No data until 1960. Number of actual observations by date: 55.
Source name:
World Development Indicators
Source organization:
(1) United Nations Population Division. World Population Prospects. New York, United Nations, Department of Economic and Social Affairs (advanced Excel tables). Available at http://esa.un.org/wpp/unpp/panel_population.htm, (2) University of California, Berkeley, and Max Planck Institute for Demographic Research. Human Mortality Database. [ www.mortality.org or www.humanmortality.de].
Categories, topics:
Health, Gender
Last updated:
apr 23, 2017
Indicators value changes by year
Minimum:
144.527
jan 1, 2015
Maximum:
502.961
jan 1, 1961
At the date of observation
Value
Absolute change
Change from previous value
jan 1, 1961
502.961
+502.961
0.0%
jan 1, 1962
492.272
-10.689
-2.13%
jan 1, 1963
481.583
-10.689
-2.17%
jan 1, 1964
467.954
-13.629
-2.83%
jan 1, 1965
454.326
-13.628
-2.91%
jan 1, 1966
440.697
-13.629
-3.0%
jan 1, 1967
427.069
-13.628
-3.09%
jan 1, 1968
413.44
-13.629
-3.19%
jan 1, 1969
399.538
-13.902
-3.36%
jan 1, 1970
385.636
-13.902
-3.48%
jan 1, 1971
371.734
-13.902
-3.6%
jan 1, 1972
357.832
-13.902
-3.74%
jan 1, 1973
343.93
-13.902
-3.89%
jan 1, 1974
333.468
-10.462
-3.04%
jan 1, 1975
323.006
-10.462
-3.14%
jan 1, 1976
312.544
-10.462
-3.24%
jan 1, 1977
302.082
-10.462
-3.35%
jan 1, 1978
291.62
-10.462
-3.46%
jan 1, 1979
286.706
-4.914
-1.69%
jan 1, 1980
281.793
-4.913
-1.71%
jan 1, 1981
276.88
-4.913
-1.74%
jan 1, 1982
271.966
-4.914
-1.77%
jan 1, 1983
267.053
-4.913
-1.81%
jan 1, 1984
264.42
-2.633
-0.99%
jan 1, 1985
261.787
-2.633
-1.0%
jan 1, 1986
259.154
-2.633
-1.01%
jan 1, 1987
256.521
-2.633
-1.02%
jan 1, 1988
253.888
-2.633
-1.03%
jan 1, 1989
248.32
-5.568
-2.19%
jan 1, 1990
242.751
-5.569
-2.24%
jan 1, 1991
237.183
-5.568
-2.29%
jan 1, 1992
231.615
-5.568
-2.35%
jan 1, 1993
226.047
-5.568
-2.4%
jan 1, 1994
221.123
-4.924
-2.18%
jan 1, 1995
216.2
-4.923
-2.23%
jan 1, 1996
211.276
-4.924
-2.28%
jan 1, 1997
206.353
-4.923
-2.33%
jan 1, 1998
201.429
-4.924
-2.39%
jan 1, 1999
198.67
-2.759
-1.37%
jan 1, 2000
195.91
-2.76
-1.39%
jan 1, 2001
193.15
-2.76
-1.41%
jan 1, 2002
190.391
-2.759
-1.43%
jan 1, 2003
187.631
-2.76
-1.45%
jan 1, 2004
184.592
-3.039
-1.62%
jan 1, 2005
181.553
-3.039
-1.65%
jan 1, 2006
178.514
-3.039
-1.67%
jan 1, 2007
175.474
-3.04
-1.7%
jan 1, 2008
172.435
-3.039
-1.73%
jan 1, 2009
168.05
-4.385
-2.54%
jan 1, 2010
163.666
-4.384
-2.61%
jan 1, 2011
159.281
-4.385
-2.68%
jan 1, 2012
154.897
-4.384
-2.75%
jan 1, 2013
150.512
-4.385
-2.83%
jan 1, 2014
147.519
-2.993
-1.99%
jan 1, 2015
144.527
-2.992
-2.03%
Ranking of countries by current statistics by years


Comments: