29
/
en
AIzaSyAYiBZKx7MnpbEhh9jyipgxe19OcubqV5w
April 1, 2024
35966
High income
HIC
false
2
1
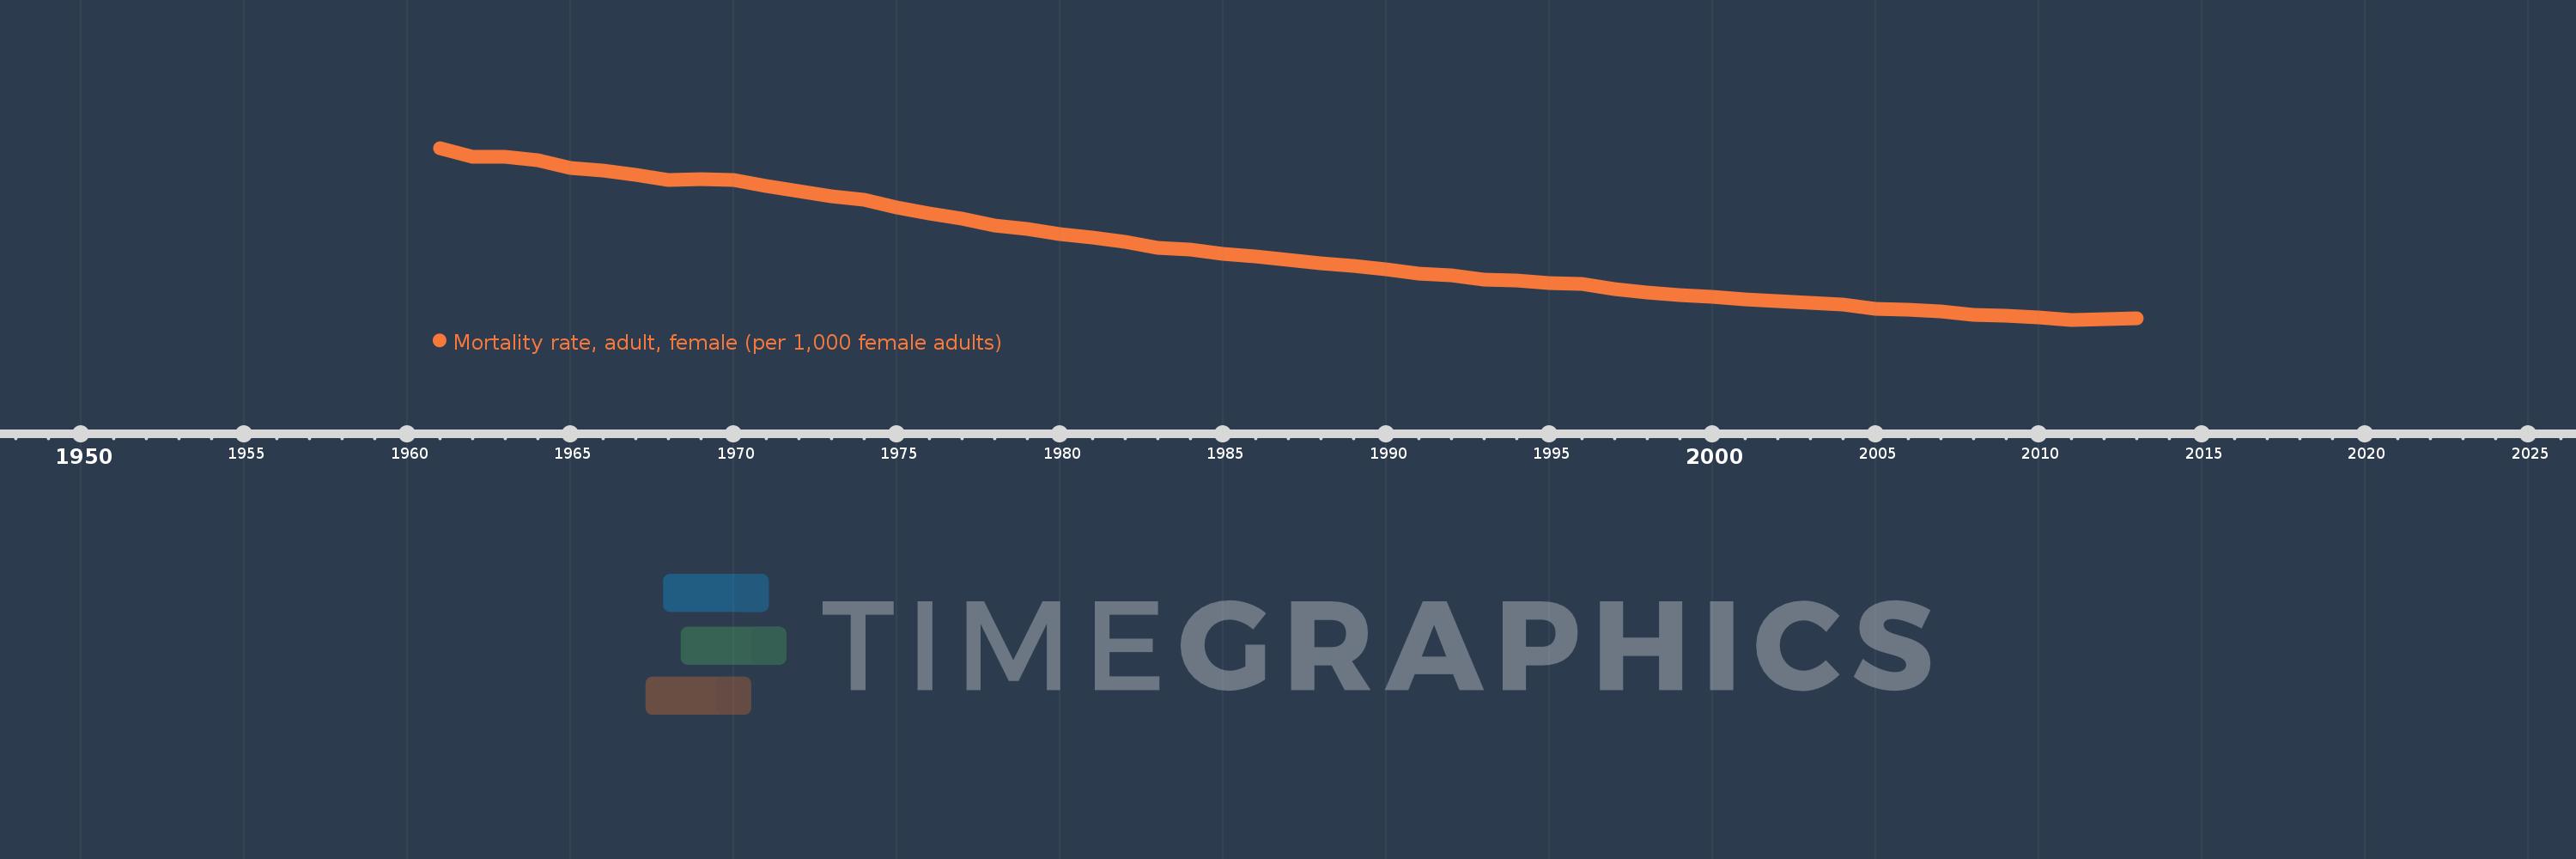
Mortality rate, adult, female (per 1,000 female adults)
2013,2012,2011,2010,2009,2008,2007,2006,2005,2004,2003,2002,2001,2000,1999,1998,1997,1996,1995,1994,1993,1992,1991,1990,1989,1988,1987,1986,1985,1984,1983,1982,1981,1980,1979,1978,1977,1976,1975,1974,1973,1972,1971,1970,1969,1968,1967,1966,1965,1964,1963,1962,1961
This statistics in other country:
AfghanistanAlbaniaAlgeriaAngolaAntigua and BarbudaArab WorldArgentinaArmeniaArubaAustraliaAustriaAzerbaijanBahamas, TheBahrainBangladeshBarbadosBelarusBelgiumBelizeBeninBhutanBoliviaBosnia and HerzegovinaBotswanaBrazilBrunei DarussalamBulgariaBurkina FasoBurundiCabo VerdeCambodiaCameroonCanadaCaribbean small statesCentral African RepublicCentral Europe and the BalticsChadChannel IslandsChileChinaColombiaComorosCongo, Dem. Rep.Congo, Rep.Costa RicaCote d'IvoireCroatiaCubaCuracaoCyprusCzech RepublicDenmarkDjiboutiDominicaDominican RepublicEarly-demographic dividendEast Asia & PacificEast Asia & Pacific (excluding high income)East Asia & Pacific (IDA & IBRD countries)EcuadorEgypt, Arab Rep.El SalvadorEquatorial GuineaEritreaEstoniaEthiopiaEuro areaEurope & Central AsiaEurope & Central Asia (excluding high income)Europe & Central Asia (IDA & IBRD countries)European UnionFijiFinlandFragile and conflict affected situationsFranceFrench PolynesiaGabonGambia, TheGeorgiaGermanyGhanaGreeceGreenlandGrenadaGuamGuatemalaGuineaGuinea-BissauGuyanaHaitiHeavily indebted poor countries (HIPC)High incomeHondurasHong Kong SAR, ChinaHungaryIBRD onlyIcelandIDA & IBRD totalIDA blendIDA onlyIDA totalIndiaIndonesiaIran, Islamic Rep.IraqIrelandIsraelItalyJamaicaJapanJordanKazakhstanKenyaKiribatiKorea, Dem. People’s Rep.Korea, Rep.KuwaitKyrgyz RepublicLao PDRLate-demographic dividendLatin America & Caribbean Latin America & Caribbean (excluding high income)Latin America & the Caribbean (IDA & IBRD countries)LatviaLeast developed countries: UN classificationLebanonLesothoLiberiaLibyaLithuaniaLow & middle incomeLow incomeLower middle incomeLuxembourgMacao SAR, ChinaMacedonia, FYRMadagascarMalawiMalaysiaMaldivesMaliMaltaMarshall IslandsMauritaniaMauritiusMexicoMicronesia, Fed. Sts.Middle East & North AfricaMiddle East & North Africa (excluding high income)Middle East & North Africa (IDA & IBRD countries)Middle incomeMoldovaMongoliaMontenegroMoroccoMozambiqueMyanmarNamibiaNepalNetherlandsNew CaledoniaNew ZealandNicaraguaNigerNigeriaNorth AmericaNorwayOECD membersOmanOther small statesPacific island small statesPakistanPanamaPapua New GuineaParaguayPeruPhilippinesPolandPortugalPost-demographic dividendPre-demographic dividendPuerto RicoQatarRomaniaRussian FederationRwandaSamoaSao Tome and PrincipeSaudi ArabiaSenegalSerbiaSeychellesSierra LeoneSingaporeSlovak RepublicSloveniaSmall statesSolomon IslandsSomaliaSouth AfricaSouth AsiaSouth Asia (IDA & IBRD)South SudanSpainSri LankaSt. Kitts and NevisSt. LuciaSt. Vincent and the GrenadinesSub-Saharan Africa Sub-Saharan Africa (excluding high income)Sub-Saharan Africa (IDA & IBRD countries)SudanSurinameSwazilandSwedenSwitzerlandSyrian Arab RepublicTajikistanTanzaniaThailandTimor-LesteTogoTongaTrinidad and TobagoTunisiaTurkeyTurkmenistanUgandaUkraineUnited Arab EmiratesUnited KingdomUnited StatesUpper middle incomeUruguayUzbekistanVanuatuVenezuela, RBVietnamVirgin Islands (U.S.)West Bank and GazaWorldYemen, Rep.ZambiaZimbabwe Timeline:
This timeline shows a graph from 1961 to 2013 of High income. No data until 1960. Number of actual observations by date: 53.
Source name:
World Development Indicators
Source organization:
(1) United Nations Population Division. World Population Prospects. New York, United Nations, Department of Economic and Social Affairs (advanced Excel tables). Available at http://esa.un.org/wpp/unpp/panel_population.htm, (2) University of California, Berkeley, and Max Planck Institute for Demographic Research. Human Mortality Database. [ www.mortality.org or www.humanmortality.de].
Categories, topics:
Health, Gender
Last updated:
apr 23, 2017
Indicators value changes by year
Minimum:
59.063
jan 1, 2011
Maximum:
132.062
jan 1, 1961
At the date of observation
Value
Absolute change
Change from previous value
jan 1, 1961
132.062
+132.062
0.0%
jan 1, 1962
128.229
-3.834
-2.9%
jan 1, 1963
128.336
+0.107
0.08%
jan 1, 1964
126.771
-1.565
-1.22%
jan 1, 1965
123.454
-3.317
-2.62%
jan 1, 1966
122.392
-1.062
-0.86%
jan 1, 1967
120.651
-1.74
-1.42%
jan 1, 1968
118.573
-2.079
-1.72%
jan 1, 1969
118.767
+0.195
0.16%
jan 1, 1970
118.571
-0.197
-0.17%
jan 1, 1971
116.071
-2.5
-2.11%
jan 1, 1972
113.531
-2.54
-2.19%
jan 1, 1973
111.618
-1.913
-1.68%
jan 1, 1974
109.92
-1.698
-1.52%
jan 1, 1975
106.612
-3.308
-3.01%
jan 1, 1976
104.144
-2.468
-2.31%
jan 1, 1977
101.976
-2.168
-2.08%
jan 1, 1978
99.207
-2.769
-2.72%
jan 1, 1979
97.66
-1.548
-1.56%
jan 1, 1980
95.358
-2.301
-2.36%
jan 1, 1981
94.175
-1.183
-1.24%
jan 1, 1982
92.004
-2.172
-2.31%
jan 1, 1983
89.612
-2.391
-2.6%
jan 1, 1984
88.812
-0.801
-0.89%
jan 1, 1985
86.96
-1.852
-2.09%
jan 1, 1986
85.986
-0.973
-1.12%
jan 1, 1987
84.326
-1.66
-1.93%
jan 1, 1988
83.005
-1.321
-1.57%
jan 1, 1989
81.824
-1.181
-1.42%
jan 1, 1990
80.467
-1.357
-1.66%
jan 1, 1991
78.687
-1.78
-2.21%
jan 1, 1992
77.917
-0.77
-0.98%
jan 1, 1993
76.262
-1.655
-2.12%
jan 1, 1994
75.86
-0.402
-0.53%
jan 1, 1995
74.681
-1.179
-1.55%
jan 1, 1996
74.257
-0.424
-0.57%
jan 1, 1997
72.217
-2.04
-2.75%
jan 1, 1998
70.647
-1.57
-2.17%
jan 1, 1999
69.364
-1.283
-1.82%
jan 1, 2000
68.791
-0.573
-0.83%
jan 1, 2001
67.824
-0.967
-1.41%
jan 1, 2002
67.126
-0.697
-1.03%
jan 1, 2003
66.251
-0.875
-1.3%
jan 1, 2004
65.587
-0.664
-1.0%
jan 1, 2005
63.875
-1.712
-2.61%
jan 1, 2006
63.317
-0.558
-0.87%
jan 1, 2007
62.423
-0.895
-1.41%
jan 1, 2008
61.299
-1.124
-1.8%
jan 1, 2009
60.746
-0.554
-0.9%
jan 1, 2010
60.227
-0.519
-0.85%
jan 1, 2011
59.063
-1.164
-1.93%
jan 1, 2012
59.401
+0.339
0.57%
jan 1, 2013
59.521
+0.119
0.2%
Ranking of countries by current statistics by years


Comments: