29
/
en
AIzaSyAYiBZKx7MnpbEhh9jyipgxe19OcubqV5w
April 1, 2024
263746
Timor-Leste
TLS
true
2
1
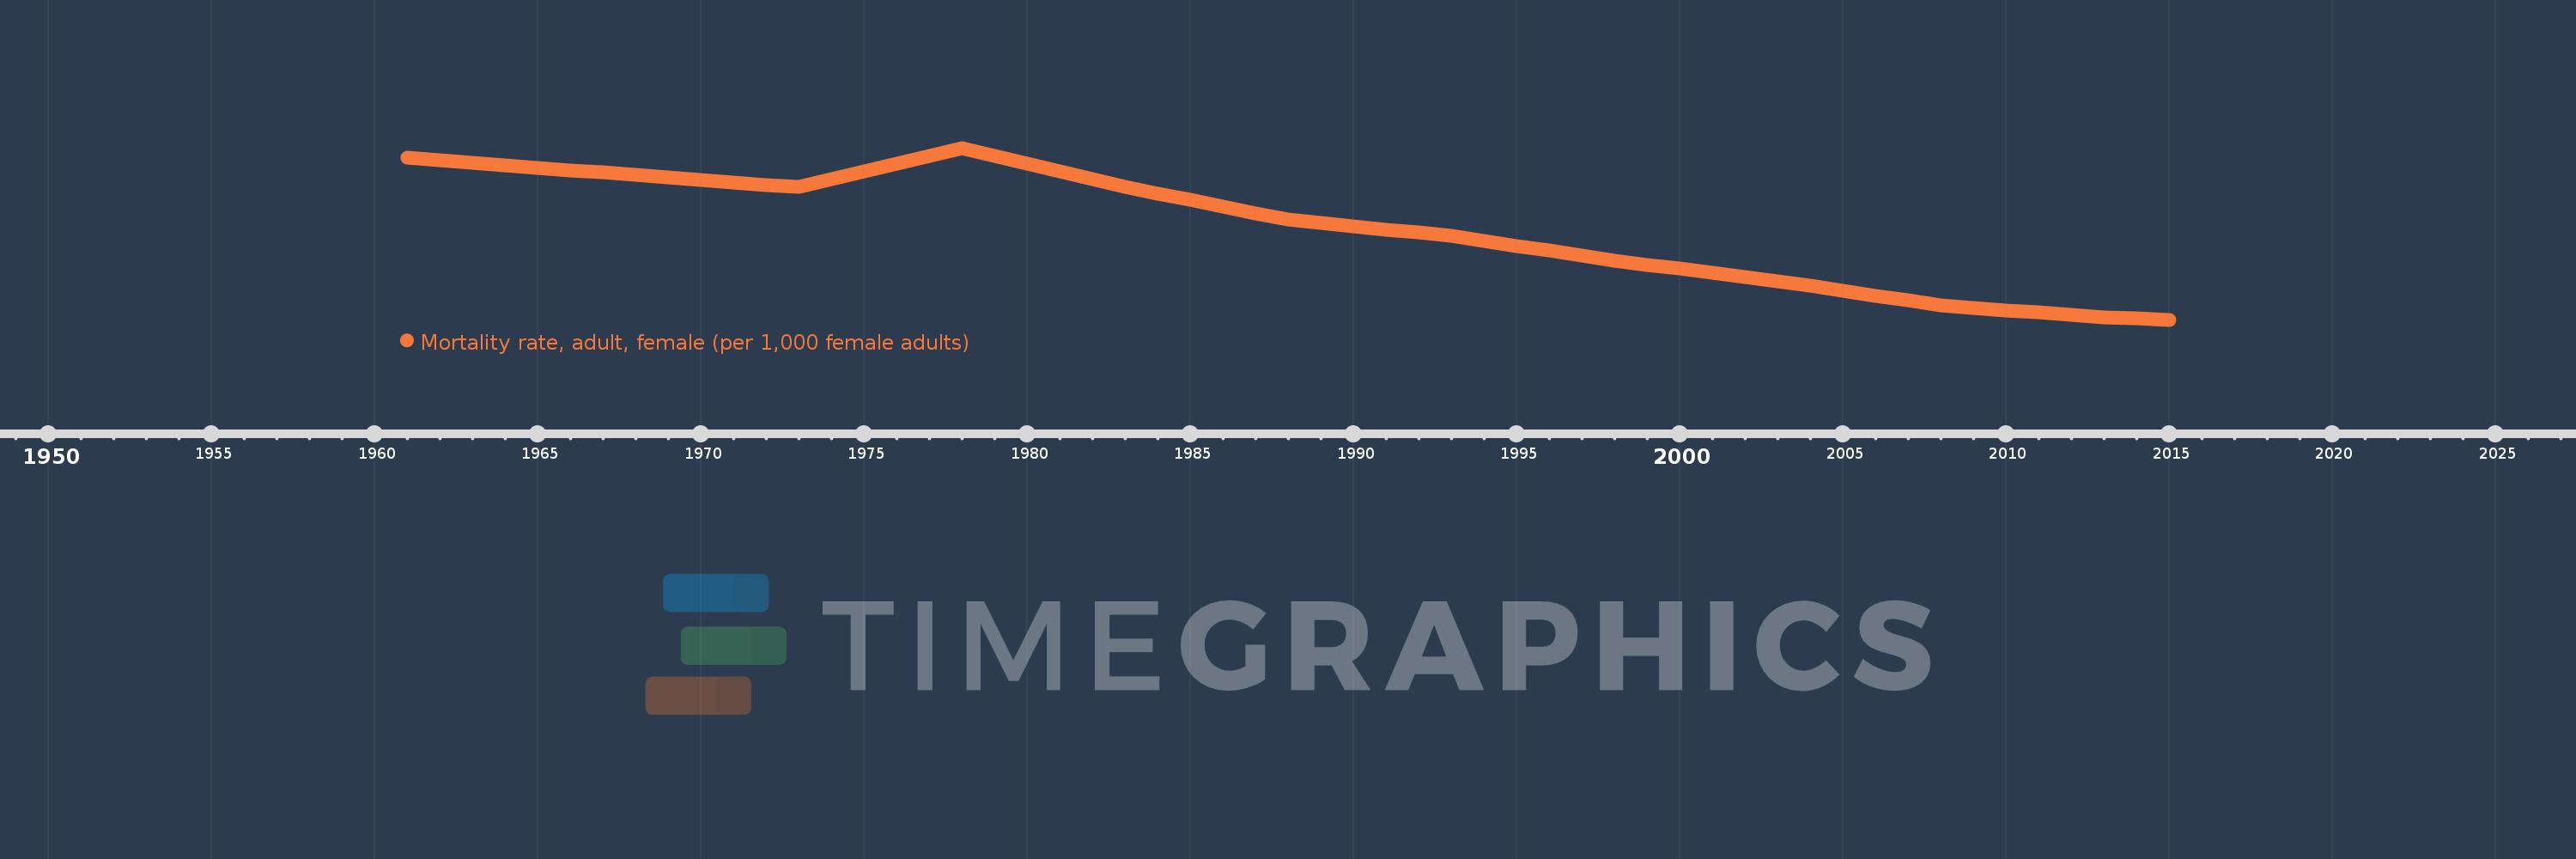
Mortality rate, adult, female (per 1,000 female adults)
2015,2014,2013,2012,2011,2010,2009,2008,2007,2006,2005,2004,2003,2002,2001,2000,1999,1998,1997,1996,1995,1994,1993,1992,1991,1990,1989,1988,1987,1986,1985,1984,1983,1982,1981,1980,1979,1978,1977,1976,1975,1974,1973,1972,1971,1970,1969,1968,1967,1966,1965,1964,1963,1962,1961
This statistics in other country:
AfghanistanAlbaniaAlgeriaAngolaAntigua and BarbudaArab WorldArgentinaArmeniaArubaAustraliaAustriaAzerbaijanBahamas, TheBahrainBangladeshBarbadosBelarusBelgiumBelizeBeninBhutanBoliviaBosnia and HerzegovinaBotswanaBrazilBrunei DarussalamBulgariaBurkina FasoBurundiCabo VerdeCambodiaCameroonCanadaCaribbean small statesCentral African RepublicCentral Europe and the BalticsChadChannel IslandsChileChinaColombiaComorosCongo, Dem. Rep.Congo, Rep.Costa RicaCote d'IvoireCroatiaCubaCuracaoCyprusCzech RepublicDenmarkDjiboutiDominicaDominican RepublicEarly-demographic dividendEast Asia & PacificEast Asia & Pacific (excluding high income)East Asia & Pacific (IDA & IBRD countries)EcuadorEgypt, Arab Rep.El SalvadorEquatorial GuineaEritreaEstoniaEthiopiaEuro areaEurope & Central AsiaEurope & Central Asia (excluding high income)Europe & Central Asia (IDA & IBRD countries)European UnionFijiFinlandFragile and conflict affected situationsFranceFrench PolynesiaGabonGambia, TheGeorgiaGermanyGhanaGreeceGreenlandGrenadaGuamGuatemalaGuineaGuinea-BissauGuyanaHaitiHeavily indebted poor countries (HIPC)High incomeHondurasHong Kong SAR, ChinaHungaryIBRD onlyIcelandIDA & IBRD totalIDA blendIDA onlyIDA totalIndiaIndonesiaIran, Islamic Rep.IraqIrelandIsraelItalyJamaicaJapanJordanKazakhstanKenyaKiribatiKorea, Dem. People’s Rep.Korea, Rep.KuwaitKyrgyz RepublicLao PDRLate-demographic dividendLatin America & Caribbean Latin America & Caribbean (excluding high income)Latin America & the Caribbean (IDA & IBRD countries)LatviaLeast developed countries: UN classificationLebanonLesothoLiberiaLibyaLithuaniaLow & middle incomeLow incomeLower middle incomeLuxembourgMacao SAR, ChinaMacedonia, FYRMadagascarMalawiMalaysiaMaldivesMaliMaltaMarshall IslandsMauritaniaMauritiusMexicoMicronesia, Fed. Sts.Middle East & North AfricaMiddle East & North Africa (excluding high income)Middle East & North Africa (IDA & IBRD countries)Middle incomeMoldovaMongoliaMontenegroMoroccoMozambiqueMyanmarNamibiaNepalNetherlandsNew CaledoniaNew ZealandNicaraguaNigerNigeriaNorth AmericaNorwayOECD membersOmanOther small statesPacific island small statesPakistanPanamaPapua New GuineaParaguayPeruPhilippinesPolandPortugalPost-demographic dividendPre-demographic dividendPuerto RicoQatarRomaniaRussian FederationRwandaSamoaSao Tome and PrincipeSaudi ArabiaSenegalSerbiaSeychellesSierra LeoneSingaporeSlovak RepublicSloveniaSmall statesSolomon IslandsSomaliaSouth AfricaSouth AsiaSouth Asia (IDA & IBRD)South SudanSpainSri LankaSt. Kitts and NevisSt. LuciaSt. Vincent and the GrenadinesSub-Saharan Africa Sub-Saharan Africa (excluding high income)Sub-Saharan Africa (IDA & IBRD countries)SudanSurinameSwazilandSwedenSwitzerlandSyrian Arab RepublicTajikistanTanzaniaThailandTimor-LesteTogoTongaTrinidad and TobagoTunisiaTurkeyTurkmenistanUgandaUkraineUnited Arab EmiratesUnited KingdomUnited StatesUpper middle incomeUruguayUzbekistanVanuatuVenezuela, RBVietnamVirgin Islands (U.S.)West Bank and GazaWorldYemen, Rep.ZambiaZimbabwe Timeline:
This timeline shows a graph from 1961 to 2015 of Timor-Leste. No data until 1960. Number of actual observations by date: 55.
Source name:
World Development Indicators
Source organization:
(1) United Nations Population Division. World Population Prospects. New York, United Nations, Department of Economic and Social Affairs (advanced Excel tables). Available at http://esa.un.org/wpp/unpp/panel_population.htm, (2) University of California, Berkeley, and Max Planck Institute for Demographic Research. Human Mortality Database. [ www.mortality.org or www.humanmortality.de].
Categories, topics:
Health, Gender
Last updated:
apr 23, 2017
Indicators value changes by year
Minimum:
127.977
jan 1, 2015
Maximum:
561.907
jan 1, 1978
At the date of observation
Value
Absolute change
Change from previous value
jan 1, 1961
536.33
+536.33
0.0%
jan 1, 1962
530.185
-6.145
-1.15%
jan 1, 1963
524.04
-6.145
-1.16%
jan 1, 1964
517.929
-6.111
-1.17%
jan 1, 1965
511.818
-6.111
-1.18%
jan 1, 1966
505.707
-6.111
-1.19%
jan 1, 1967
499.596
-6.111
-1.21%
jan 1, 1968
493.485
-6.111
-1.22%
jan 1, 1969
487.367
-6.118
-1.24%
jan 1, 1970
481.248
-6.119
-1.26%
jan 1, 1971
475.13
-6.118
-1.27%
jan 1, 1972
469.011
-6.119
-1.29%
jan 1, 1973
462.893
-6.118
-1.3%
jan 1, 1974
482.696
+19.803
4.28%
jan 1, 1975
502.498
+19.802
4.1%
jan 1, 1976
522.301
+19.803
3.94%
jan 1, 1977
542.104
+19.803
3.79%
jan 1, 1978
561.907
+19.803
3.65%
jan 1, 1979
542.197
-19.71
-3.51%
jan 1, 1980
522.488
-19.709
-3.64%
jan 1, 1981
502.778
-19.71
-3.77%
jan 1, 1982
483.068
-19.71
-3.92%
jan 1, 1983
463.359
-19.709
-4.08%
jan 1, 1984
446.709
-16.65
-3.59%
jan 1, 1985
430.058
-16.651
-3.73%
jan 1, 1986
413.408
-16.65
-3.87%
jan 1, 1987
396.757
-16.651
-4.03%
jan 1, 1988
380.107
-16.65
-4.2%
jan 1, 1989
371.992
-8.115
-2.13%
jan 1, 1990
363.877
-8.115
-2.18%
jan 1, 1991
355.762
-8.115
-2.23%
jan 1, 1992
347.647
-8.115
-2.28%
jan 1, 1993
339.532
-8.115
-2.33%
jan 1, 1994
327.128
-12.404
-3.65%
jan 1, 1995
314.724
-12.404
-3.79%
jan 1, 1996
302.32
-12.404
-3.94%
jan 1, 1997
289.916
-12.404
-4.1%
jan 1, 1998
277.512
-12.404
-4.28%
jan 1, 1999
267.064
-10.448
-3.76%
jan 1, 2000
256.617
-10.447
-3.91%
jan 1, 2001
246.17
-10.447
-4.07%
jan 1, 2002
235.722
-10.448
-4.24%
jan 1, 2003
225.275
-10.447
-4.43%
jan 1, 2004
213.091
-12.184
-5.41%
jan 1, 2005
200.908
-12.183
-5.72%
jan 1, 2006
188.725
-12.183
-6.06%
jan 1, 2007
176.541
-12.184
-6.46%
jan 1, 2008
164.358
-12.183
-6.9%
jan 1, 2009
158.257
-6.101
-3.71%
jan 1, 2010
152.155
-6.102
-3.86%
jan 1, 2011
146.054
-6.101
-4.01%
jan 1, 2012
139.953
-6.101
-4.18%
jan 1, 2013
133.851
-6.102
-4.36%
jan 1, 2014
130.914
-2.937
-2.19%
jan 1, 2015
127.977
-2.937
-2.24%
Ranking of countries by current statistics by years


Comments: