29
/
en
AIzaSyAYiBZKx7MnpbEhh9jyipgxe19OcubqV5w
April 1, 2024
230068
Russian Federation
RUS
true
2
1
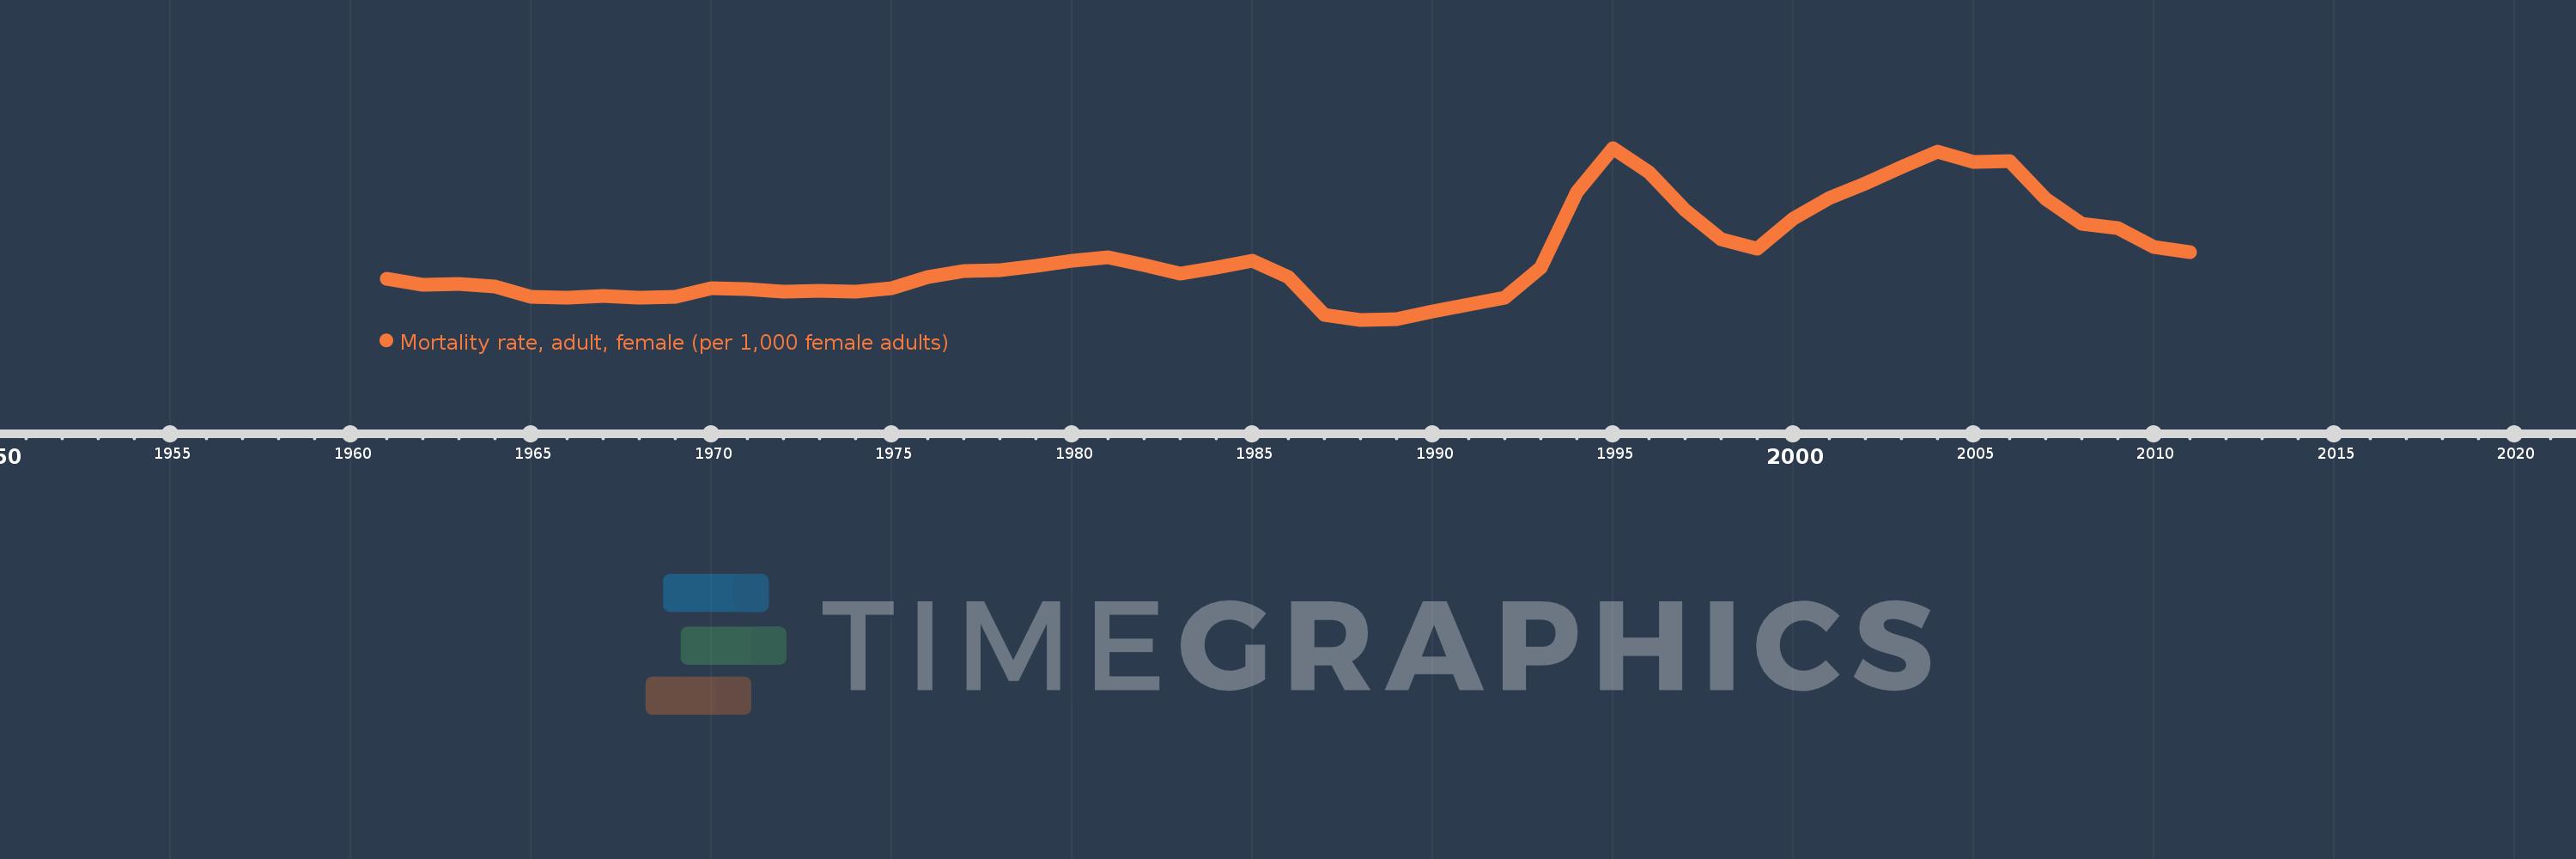
Mortality rate, adult, female (per 1,000 female adults)
2011,2010,2009,2008,2007,2006,2005,2004,2003,2002,2001,2000,1999,1998,1997,1996,1995,1994,1993,1992,1991,1990,1989,1988,1987,1986,1985,1984,1983,1982,1981,1980,1979,1978,1977,1976,1975,1974,1973,1972,1971,1970,1969,1968,1967,1966,1965,1964,1963,1962,1961
This statistics in other country:
AfghanistanAlbaniaAlgeriaAngolaAntigua and BarbudaArab WorldArgentinaArmeniaArubaAustraliaAustriaAzerbaijanBahamas, TheBahrainBangladeshBarbadosBelarusBelgiumBelizeBeninBhutanBoliviaBosnia and HerzegovinaBotswanaBrazilBrunei DarussalamBulgariaBurkina FasoBurundiCabo VerdeCambodiaCameroonCanadaCaribbean small statesCentral African RepublicCentral Europe and the BalticsChadChannel IslandsChileChinaColombiaComorosCongo, Dem. Rep.Congo, Rep.Costa RicaCote d'IvoireCroatiaCubaCuracaoCyprusCzech RepublicDenmarkDjiboutiDominicaDominican RepublicEarly-demographic dividendEast Asia & PacificEast Asia & Pacific (excluding high income)East Asia & Pacific (IDA & IBRD countries)EcuadorEgypt, Arab Rep.El SalvadorEquatorial GuineaEritreaEstoniaEthiopiaEuro areaEurope & Central AsiaEurope & Central Asia (excluding high income)Europe & Central Asia (IDA & IBRD countries)European UnionFijiFinlandFragile and conflict affected situationsFranceFrench PolynesiaGabonGambia, TheGeorgiaGermanyGhanaGreeceGreenlandGrenadaGuamGuatemalaGuineaGuinea-BissauGuyanaHaitiHeavily indebted poor countries (HIPC)High incomeHondurasHong Kong SAR, ChinaHungaryIBRD onlyIcelandIDA & IBRD totalIDA blendIDA onlyIDA totalIndiaIndonesiaIran, Islamic Rep.IraqIrelandIsraelItalyJamaicaJapanJordanKazakhstanKenyaKiribatiKorea, Dem. People’s Rep.Korea, Rep.KuwaitKyrgyz RepublicLao PDRLate-demographic dividendLatin America & Caribbean Latin America & Caribbean (excluding high income)Latin America & the Caribbean (IDA & IBRD countries)LatviaLeast developed countries: UN classificationLebanonLesothoLiberiaLibyaLithuaniaLow & middle incomeLow incomeLower middle incomeLuxembourgMacao SAR, ChinaMacedonia, FYRMadagascarMalawiMalaysiaMaldivesMaliMaltaMarshall IslandsMauritaniaMauritiusMexicoMicronesia, Fed. Sts.Middle East & North AfricaMiddle East & North Africa (excluding high income)Middle East & North Africa (IDA & IBRD countries)Middle incomeMoldovaMongoliaMontenegroMoroccoMozambiqueMyanmarNamibiaNepalNetherlandsNew CaledoniaNew ZealandNicaraguaNigerNigeriaNorth AmericaNorwayOECD membersOmanOther small statesPacific island small statesPakistanPanamaPapua New GuineaParaguayPeruPhilippinesPolandPortugalPost-demographic dividendPre-demographic dividendPuerto RicoQatarRomaniaRussian FederationRwandaSamoaSao Tome and PrincipeSaudi ArabiaSenegalSerbiaSeychellesSierra LeoneSingaporeSlovak RepublicSloveniaSmall statesSolomon IslandsSomaliaSouth AfricaSouth AsiaSouth Asia (IDA & IBRD)South SudanSpainSri LankaSt. Kitts and NevisSt. LuciaSt. Vincent and the GrenadinesSub-Saharan Africa Sub-Saharan Africa (excluding high income)Sub-Saharan Africa (IDA & IBRD countries)SudanSurinameSwazilandSwedenSwitzerlandSyrian Arab RepublicTajikistanTanzaniaThailandTimor-LesteTogoTongaTrinidad and TobagoTunisiaTurkeyTurkmenistanUgandaUkraineUnited Arab EmiratesUnited KingdomUnited StatesUpper middle incomeUruguayUzbekistanVanuatuVenezuela, RBVietnamVirgin Islands (U.S.)West Bank and GazaWorldYemen, Rep.ZambiaZimbabwe Timeline:
This timeline shows a graph from 1961 to 2011 of Russian Federation. No data until 1960. Number of actual observations by date: 51.
Source name:
World Development Indicators
Source organization:
(1) United Nations Population Division. World Population Prospects. New York, United Nations, Department of Economic and Social Affairs (advanced Excel tables). Available at http://esa.un.org/wpp/unpp/panel_population.htm, (2) University of California, Berkeley, and Max Planck Institute for Demographic Research. Human Mortality Database. [ www.mortality.org or www.humanmortality.de].
Categories, topics:
Health, Gender
Last updated:
apr 23, 2017
Indicators value changes by year
Minimum:
110.243
jan 1, 1988
Maximum:
178.406
jan 1, 1995
At the date of observation
Value
Absolute change
Change from previous value
jan 1, 1961
126.477
+126.477
0.0%
jan 1, 1962
124.168
-2.309
-1.83%
jan 1, 1963
124.424
+0.256
0.21%
jan 1, 1964
123.318
-1.106
-0.89%
jan 1, 1965
119.312
-4.006
-3.25%
jan 1, 1966
118.976
-0.336
-0.28%
jan 1, 1967
119.555
+0.579
0.49%
jan 1, 1968
119.097
-0.458
-0.38%
jan 1, 1969
119.243
+0.146
0.12%
jan 1, 1970
122.902
+3.659
3.07%
jan 1, 1971
122.529
-0.373
-0.3%
jan 1, 1972
121.301
-1.228
-1.0%
jan 1, 1973
121.797
+0.496
0.41%
jan 1, 1974
121.495
-0.302
-0.25%
jan 1, 1975
122.798
+1.303
1.07%
jan 1, 1976
127.205
+4.407
3.59%
jan 1, 1977
129.634
+2.429
1.91%
jan 1, 1978
129.857
+0.223
0.17%
jan 1, 1979
131.772
+1.915
1.47%
jan 1, 1980
133.56
+1.788
1.36%
jan 1, 1981
134.906
+1.346
1.01%
jan 1, 1982
131.951
-2.955
-2.19%
jan 1, 1983
128.506
-3.445
-2.61%
jan 1, 1984
130.859
+2.353
1.83%
jan 1, 1985
133.713
+2.854
2.18%
jan 1, 1986
127.211
-6.502
-4.86%
jan 1, 1987
112.045
-15.166
-11.92%
jan 1, 1988
110.243
-1.802
-1.61%
jan 1, 1989
110.328
+0.085
0.08%
jan 1, 1990
113.531
+3.203
2.9%
jan 1, 1991
116.2
+2.669
2.35%
jan 1, 1992
118.919
+2.719
2.34%
jan 1, 1993
130.912
+11.993
10.09%
jan 1, 1994
160.861
+29.949
22.88%
jan 1, 1995
178.406
+17.545
10.91%
jan 1, 1996
168.924
-9.482
-5.31%
jan 1, 1997
153.784
-15.14
-8.96%
jan 1, 1998
142.343
-11.441
-7.44%
jan 1, 1999
138.573
-3.77
-2.65%
jan 1, 2000
150.485
+11.912
8.6%
jan 1, 2001
158.477
+7.992
5.31%
jan 1, 2002
164.299
+5.822
3.67%
jan 1, 2003
170.956
+6.657
4.05%
jan 1, 2004
176.833
+5.877
3.44%
jan 1, 2005
172.883
-3.95
-2.23%
jan 1, 2006
173.334
+0.451
0.26%
jan 1, 2007
158.173
-15.161
-8.75%
jan 1, 2008
148.228
-9.945
-6.29%
jan 1, 2009
146.717
-1.511
-1.02%
jan 1, 2010
139.205
-7.512
-5.12%
jan 1, 2011
137.189
-2.016
-1.45%
Ranking of countries by current statistics by years


Comments: