29
/
en
AIzaSyAYiBZKx7MnpbEhh9jyipgxe19OcubqV5w
April 1, 2024
30917
Europe & Central Asia
ECS
false
2
1
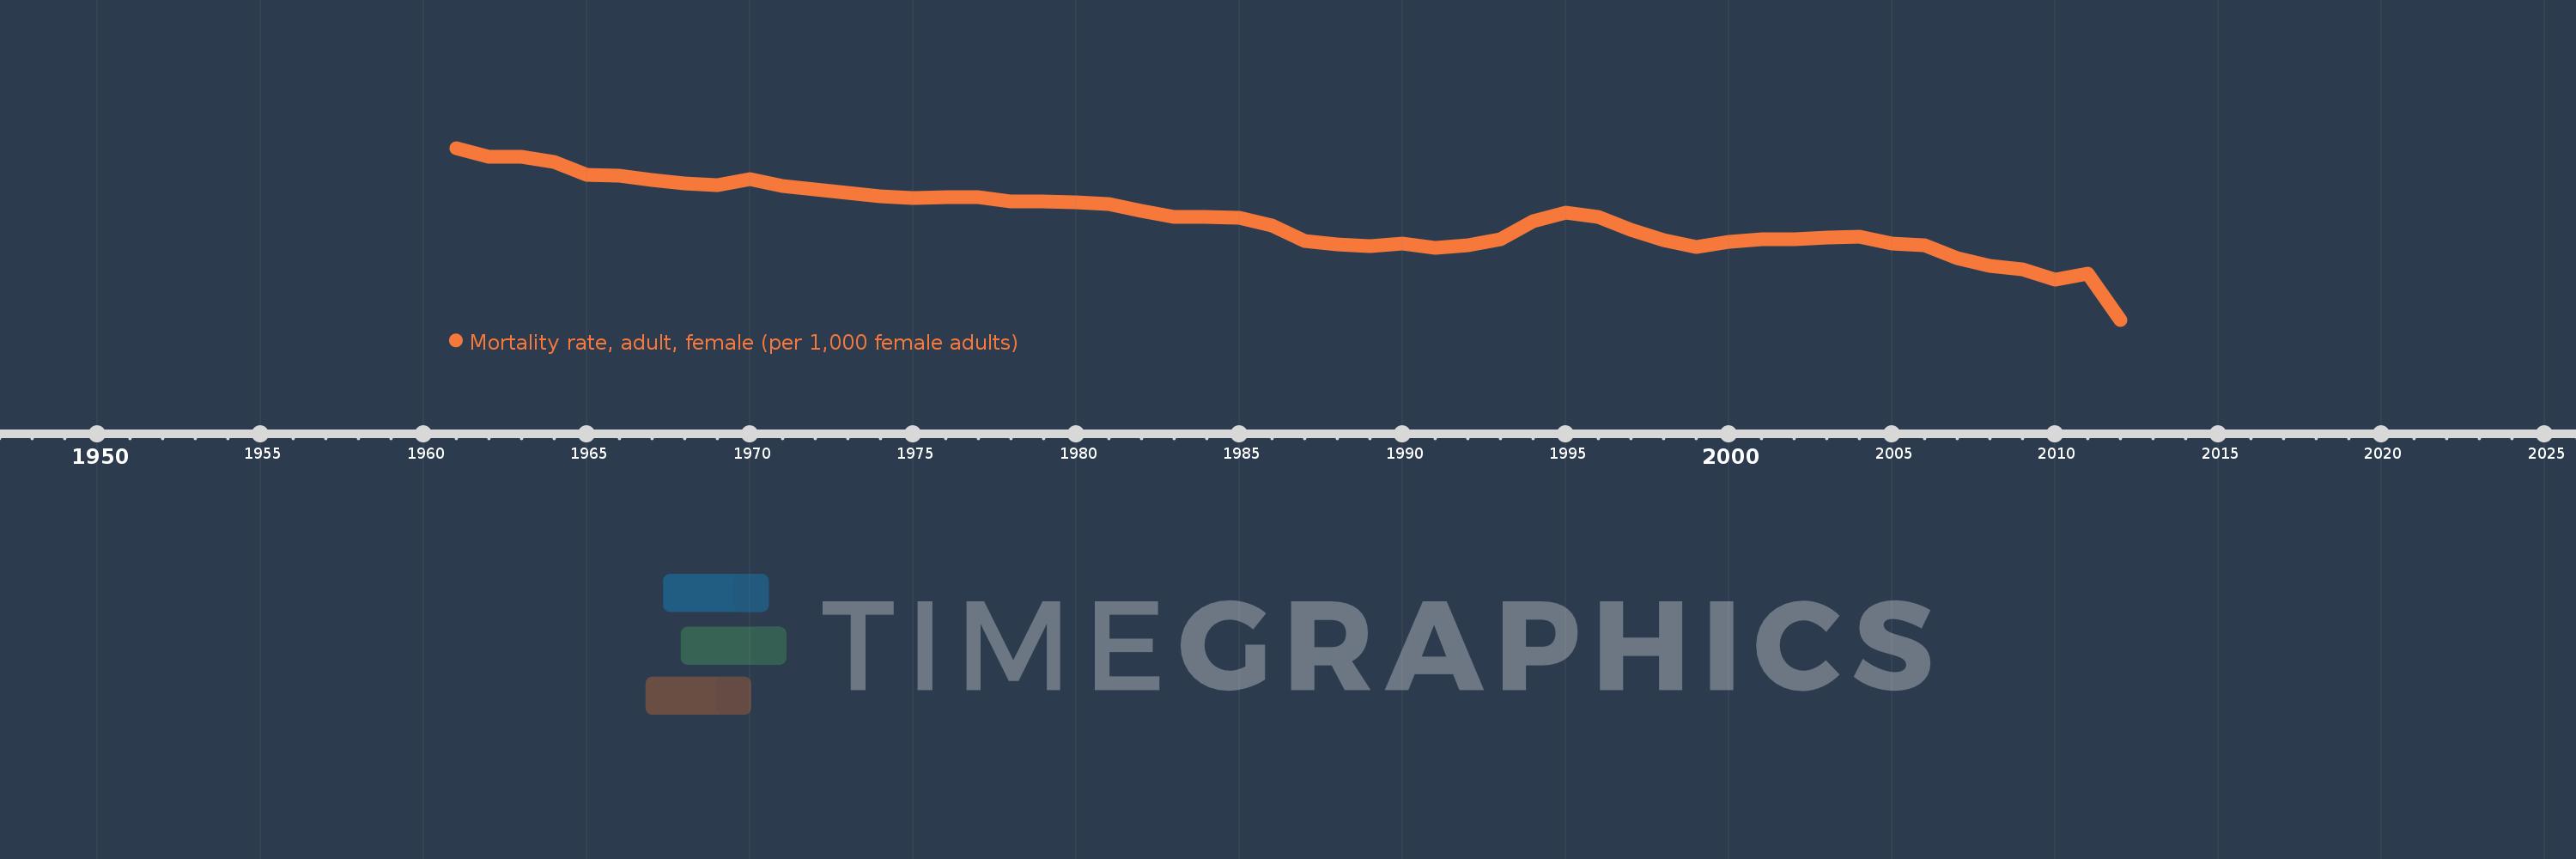
Mortality rate, adult, female (per 1,000 female adults)
2012,2011,2010,2009,2008,2007,2006,2005,2004,2003,2002,2001,2000,1999,1998,1997,1996,1995,1994,1993,1992,1991,1990,1989,1988,1987,1986,1985,1984,1983,1982,1981,1980,1979,1978,1977,1976,1975,1974,1973,1972,1971,1970,1969,1968,1967,1966,1965,1964,1963,1962,1961
This statistics in other country:
AfghanistanAlbaniaAlgeriaAngolaAntigua and BarbudaArab WorldArgentinaArmeniaArubaAustraliaAustriaAzerbaijanBahamas, TheBahrainBangladeshBarbadosBelarusBelgiumBelizeBeninBhutanBoliviaBosnia and HerzegovinaBotswanaBrazilBrunei DarussalamBulgariaBurkina FasoBurundiCabo VerdeCambodiaCameroonCanadaCaribbean small statesCentral African RepublicCentral Europe and the BalticsChadChannel IslandsChileChinaColombiaComorosCongo, Dem. Rep.Congo, Rep.Costa RicaCote d'IvoireCroatiaCubaCuracaoCyprusCzech RepublicDenmarkDjiboutiDominicaDominican RepublicEarly-demographic dividendEast Asia & PacificEast Asia & Pacific (excluding high income)East Asia & Pacific (IDA & IBRD countries)EcuadorEgypt, Arab Rep.El SalvadorEquatorial GuineaEritreaEstoniaEthiopiaEuro areaEurope & Central AsiaEurope & Central Asia (excluding high income)Europe & Central Asia (IDA & IBRD countries)European UnionFijiFinlandFragile and conflict affected situationsFranceFrench PolynesiaGabonGambia, TheGeorgiaGermanyGhanaGreeceGreenlandGrenadaGuamGuatemalaGuineaGuinea-BissauGuyanaHaitiHeavily indebted poor countries (HIPC)High incomeHondurasHong Kong SAR, ChinaHungaryIBRD onlyIcelandIDA & IBRD totalIDA blendIDA onlyIDA totalIndiaIndonesiaIran, Islamic Rep.IraqIrelandIsraelItalyJamaicaJapanJordanKazakhstanKenyaKiribatiKorea, Dem. People’s Rep.Korea, Rep.KuwaitKyrgyz RepublicLao PDRLate-demographic dividendLatin America & Caribbean Latin America & Caribbean (excluding high income)Latin America & the Caribbean (IDA & IBRD countries)LatviaLeast developed countries: UN classificationLebanonLesothoLiberiaLibyaLithuaniaLow & middle incomeLow incomeLower middle incomeLuxembourgMacao SAR, ChinaMacedonia, FYRMadagascarMalawiMalaysiaMaldivesMaliMaltaMarshall IslandsMauritaniaMauritiusMexicoMicronesia, Fed. Sts.Middle East & North AfricaMiddle East & North Africa (excluding high income)Middle East & North Africa (IDA & IBRD countries)Middle incomeMoldovaMongoliaMontenegroMoroccoMozambiqueMyanmarNamibiaNepalNetherlandsNew CaledoniaNew ZealandNicaraguaNigerNigeriaNorth AmericaNorwayOECD membersOmanOther small statesPacific island small statesPakistanPanamaPapua New GuineaParaguayPeruPhilippinesPolandPortugalPost-demographic dividendPre-demographic dividendPuerto RicoQatarRomaniaRussian FederationRwandaSamoaSao Tome and PrincipeSaudi ArabiaSenegalSerbiaSeychellesSierra LeoneSingaporeSlovak RepublicSloveniaSmall statesSolomon IslandsSomaliaSouth AfricaSouth AsiaSouth Asia (IDA & IBRD)South SudanSpainSri LankaSt. Kitts and NevisSt. LuciaSt. Vincent and the GrenadinesSub-Saharan Africa Sub-Saharan Africa (excluding high income)Sub-Saharan Africa (IDA & IBRD countries)SudanSurinameSwazilandSwedenSwitzerlandSyrian Arab RepublicTajikistanTanzaniaThailandTimor-LesteTogoTongaTrinidad and TobagoTunisiaTurkeyTurkmenistanUgandaUkraineUnited Arab EmiratesUnited KingdomUnited StatesUpper middle incomeUruguayUzbekistanVanuatuVenezuela, RBVietnamVirgin Islands (U.S.)West Bank and GazaWorldYemen, Rep.ZambiaZimbabwe Timeline:
This timeline shows a graph from 1961 to 2012 of Europe & Central Asia. No data until 1960. Number of actual observations by date: 52.
Source name:
World Development Indicators
Source organization:
(1) United Nations Population Division. World Population Prospects. New York, United Nations, Department of Economic and Social Affairs (advanced Excel tables). Available at http://esa.un.org/wpp/unpp/panel_population.htm, (2) University of California, Berkeley, and Max Planck Institute for Demographic Research. Human Mortality Database. [ www.mortality.org or www.humanmortality.de].
Categories, topics:
Health, Gender
Last updated:
apr 23, 2017
Indicators value changes by year
Minimum:
72.098
jan 1, 2012
Maximum:
126.705
jan 1, 1961
At the date of observation
Value
Absolute change
Change from previous value
jan 1, 1961
126.705
+126.705
0.0%
jan 1, 1962
123.904
-2.801
-2.21%
jan 1, 1963
123.802
-0.102
-0.08%
jan 1, 1964
122.208
-1.594
-1.29%
jan 1, 1965
118.248
-3.959
-3.24%
jan 1, 1966
117.759
-0.489
-0.41%
jan 1, 1967
116.499
-1.261
-1.07%
jan 1, 1968
115.48
-1.019
-0.87%
jan 1, 1969
114.979
-0.501
-0.43%
jan 1, 1970
116.781
+1.802
1.57%
jan 1, 1971
114.581
-2.199
-1.88%
jan 1, 1972
113.488
-1.093
-0.95%
jan 1, 1973
112.536
-0.952
-0.84%
jan 1, 1974
111.424
-1.112
-0.99%
jan 1, 1975
110.685
-0.739
-0.66%
jan 1, 1976
111.172
+0.487
0.44%
jan 1, 1977
111.085
-0.087
-0.08%
jan 1, 1978
109.65
-1.435
-1.29%
jan 1, 1979
109.739
+0.089
0.08%
jan 1, 1980
109.432
-0.307
-0.28%
jan 1, 1981
108.795
-0.637
-0.58%
jan 1, 1982
106.819
-1.976
-1.82%
jan 1, 1983
104.751
-2.068
-1.94%
jan 1, 1984
104.777
+0.027
0.03%
jan 1, 1985
104.391
-0.387
-0.37%
jan 1, 1986
102.177
-2.214
-2.12%
jan 1, 1987
97.122
-5.055
-4.95%
jan 1, 1988
95.926
-1.195
-1.23%
jan 1, 1989
95.498
-0.428
-0.45%
jan 1, 1990
96.309
+0.811
0.85%
jan 1, 1991
94.951
-1.358
-1.41%
jan 1, 1992
95.785
+0.834
0.88%
jan 1, 1993
97.716
+1.93
2.02%
jan 1, 1994
103.388
+5.672
5.8%
jan 1, 1995
106.19
+2.803
2.71%
jan 1, 1996
104.75
-1.44
-1.36%
jan 1, 1997
100.787
-3.964
-3.78%
jan 1, 1998
97.533
-3.254
-3.23%
jan 1, 1999
95.188
-2.345
-2.4%
jan 1, 2000
96.919
+1.731
1.82%
jan 1, 2001
97.548
+0.629
0.65%
jan 1, 2002
97.717
+0.169
0.17%
jan 1, 2003
98.296
+0.579
0.59%
jan 1, 2004
98.541
+0.245
0.25%
jan 1, 2005
96.409
-2.133
-2.16%
jan 1, 2006
95.889
-0.52
-0.54%
jan 1, 2007
91.609
-4.28
-4.46%
jan 1, 2008
89.195
-2.414
-2.64%
jan 1, 2009
88.089
-1.106
-1.24%
jan 1, 2010
84.87
-3.219
-3.65%
jan 1, 2011
86.634
+1.764
2.08%
jan 1, 2012
72.098
-14.536
-16.78%
Ranking of countries by current statistics by years


Comments: