29
/
en
AIzaSyAYiBZKx7MnpbEhh9jyipgxe19OcubqV5w
April 1, 2024
234906
Saudi Arabia
SAU
true
2
1
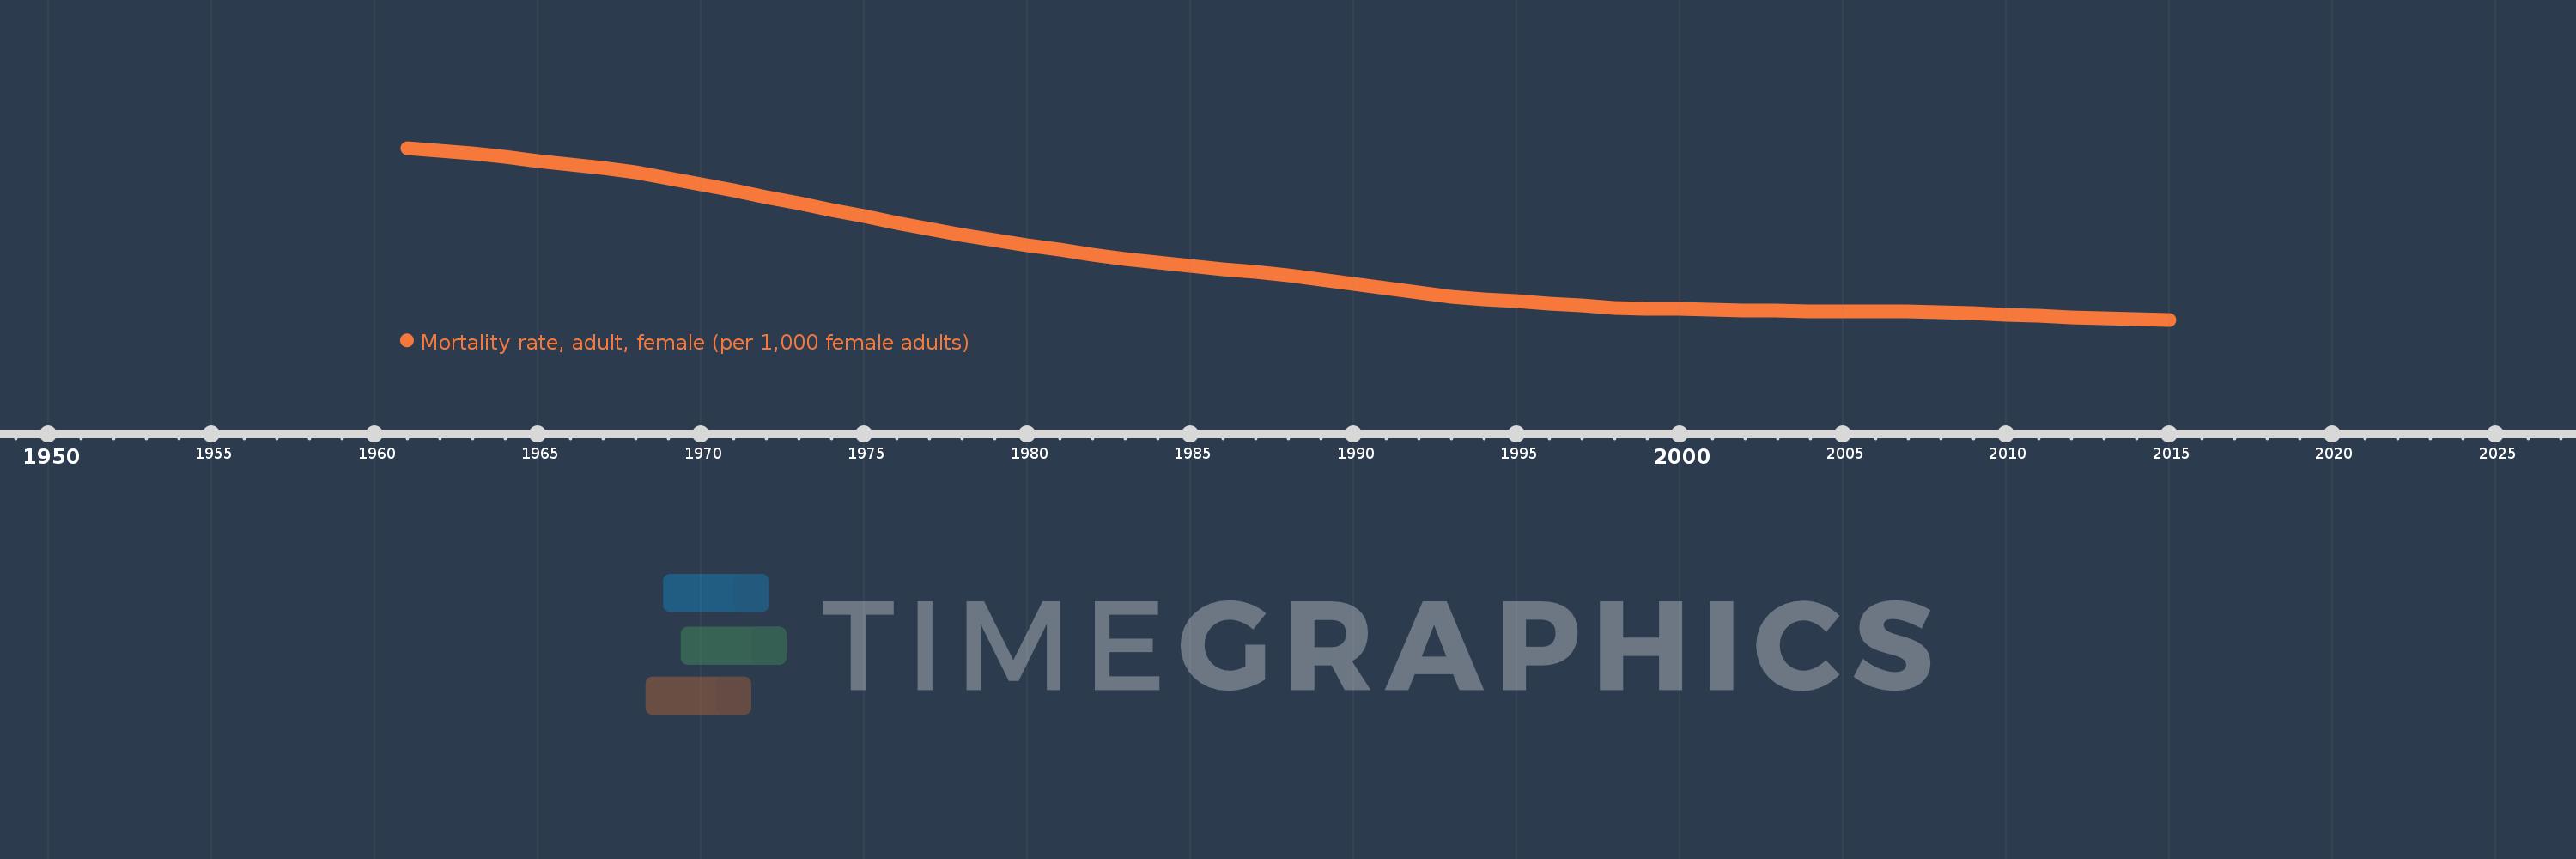
Mortality rate, adult, female (per 1,000 female adults)
2015,2014,2013,2012,2011,2010,2009,2008,2007,2006,2005,2004,2003,2002,2001,2000,1999,1998,1997,1996,1995,1994,1993,1992,1991,1990,1989,1988,1987,1986,1985,1984,1983,1982,1981,1980,1979,1978,1977,1976,1975,1974,1973,1972,1971,1970,1969,1968,1967,1966,1965,1964,1963,1962,1961
This statistics in other country:
AfghanistanAlbaniaAlgeriaAngolaAntigua and BarbudaArab WorldArgentinaArmeniaArubaAustraliaAustriaAzerbaijanBahamas, TheBahrainBangladeshBarbadosBelarusBelgiumBelizeBeninBhutanBoliviaBosnia and HerzegovinaBotswanaBrazilBrunei DarussalamBulgariaBurkina FasoBurundiCabo VerdeCambodiaCameroonCanadaCaribbean small statesCentral African RepublicCentral Europe and the BalticsChadChannel IslandsChileChinaColombiaComorosCongo, Dem. Rep.Congo, Rep.Costa RicaCote d'IvoireCroatiaCubaCuracaoCyprusCzech RepublicDenmarkDjiboutiDominicaDominican RepublicEarly-demographic dividendEast Asia & PacificEast Asia & Pacific (excluding high income)East Asia & Pacific (IDA & IBRD countries)EcuadorEgypt, Arab Rep.El SalvadorEquatorial GuineaEritreaEstoniaEthiopiaEuro areaEurope & Central AsiaEurope & Central Asia (excluding high income)Europe & Central Asia (IDA & IBRD countries)European UnionFijiFinlandFragile and conflict affected situationsFranceFrench PolynesiaGabonGambia, TheGeorgiaGermanyGhanaGreeceGreenlandGrenadaGuamGuatemalaGuineaGuinea-BissauGuyanaHaitiHeavily indebted poor countries (HIPC)High incomeHondurasHong Kong SAR, ChinaHungaryIBRD onlyIcelandIDA & IBRD totalIDA blendIDA onlyIDA totalIndiaIndonesiaIran, Islamic Rep.IraqIrelandIsraelItalyJamaicaJapanJordanKazakhstanKenyaKiribatiKorea, Dem. People’s Rep.Korea, Rep.KuwaitKyrgyz RepublicLao PDRLate-demographic dividendLatin America & Caribbean Latin America & Caribbean (excluding high income)Latin America & the Caribbean (IDA & IBRD countries)LatviaLeast developed countries: UN classificationLebanonLesothoLiberiaLibyaLithuaniaLow & middle incomeLow incomeLower middle incomeLuxembourgMacao SAR, ChinaMacedonia, FYRMadagascarMalawiMalaysiaMaldivesMaliMaltaMarshall IslandsMauritaniaMauritiusMexicoMicronesia, Fed. Sts.Middle East & North AfricaMiddle East & North Africa (excluding high income)Middle East & North Africa (IDA & IBRD countries)Middle incomeMoldovaMongoliaMontenegroMoroccoMozambiqueMyanmarNamibiaNepalNetherlandsNew CaledoniaNew ZealandNicaraguaNigerNigeriaNorth AmericaNorwayOECD membersOmanOther small statesPacific island small statesPakistanPanamaPapua New GuineaParaguayPeruPhilippinesPolandPortugalPost-demographic dividendPre-demographic dividendPuerto RicoQatarRomaniaRussian FederationRwandaSamoaSao Tome and PrincipeSaudi ArabiaSenegalSerbiaSeychellesSierra LeoneSingaporeSlovak RepublicSloveniaSmall statesSolomon IslandsSomaliaSouth AfricaSouth AsiaSouth Asia (IDA & IBRD)South SudanSpainSri LankaSt. Kitts and NevisSt. LuciaSt. Vincent and the GrenadinesSub-Saharan Africa Sub-Saharan Africa (excluding high income)Sub-Saharan Africa (IDA & IBRD countries)SudanSurinameSwazilandSwedenSwitzerlandSyrian Arab RepublicTajikistanTanzaniaThailandTimor-LesteTogoTongaTrinidad and TobagoTunisiaTurkeyTurkmenistanUgandaUkraineUnited Arab EmiratesUnited KingdomUnited StatesUpper middle incomeUruguayUzbekistanVanuatuVenezuela, RBVietnamVirgin Islands (U.S.)West Bank and GazaWorldYemen, Rep.ZambiaZimbabwe Timeline:
This timeline shows a graph from 1961 to 2015 of Saudi Arabia. No data until 1960. Number of actual observations by date: 55.
Source name:
World Development Indicators
Source organization:
(1) United Nations Population Division. World Population Prospects. New York, United Nations, Department of Economic and Social Affairs (advanced Excel tables). Available at http://esa.un.org/wpp/unpp/panel_population.htm, (2) University of California, Berkeley, and Max Planck Institute for Demographic Research. Human Mortality Database. [ www.mortality.org or www.humanmortality.de].
Categories, topics:
Health, Gender
Last updated:
apr 23, 2017
Indicators value changes by year
Minimum:
80.176
jan 1, 2015
Maximum:
326.737
jan 1, 1961
At the date of observation
Value
Absolute change
Change from previous value
jan 1, 1961
326.737
+326.737
0.0%
jan 1, 1962
322.848
-3.889
-1.19%
jan 1, 1963
318.959
-3.889
-1.2%
jan 1, 1964
313.629
-5.33
-1.67%
jan 1, 1965
308.298
-5.331
-1.7%
jan 1, 1966
302.967
-5.331
-1.73%
jan 1, 1967
297.637
-5.33
-1.76%
jan 1, 1968
292.306
-5.331
-1.79%
jan 1, 1969
283.327
-8.979
-3.07%
jan 1, 1970
274.348
-8.979
-3.17%
jan 1, 1971
265.37
-8.978
-3.27%
jan 1, 1972
256.391
-8.979
-3.38%
jan 1, 1973
247.412
-8.979
-3.5%
jan 1, 1974
238.179
-9.233
-3.73%
jan 1, 1975
228.947
-9.232
-3.88%
jan 1, 1976
219.714
-9.233
-4.03%
jan 1, 1977
210.481
-9.233
-4.2%
jan 1, 1978
201.249
-9.232
-4.39%
jan 1, 1979
194.381
-6.868
-3.41%
jan 1, 1980
187.513
-6.868
-3.53%
jan 1, 1981
180.645
-6.868
-3.66%
jan 1, 1982
173.777
-6.868
-3.8%
jan 1, 1983
166.91
-6.867
-3.95%
jan 1, 1984
162.277
-4.633
-2.78%
jan 1, 1985
157.643
-4.634
-2.86%
jan 1, 1986
153.01
-4.633
-2.94%
jan 1, 1987
148.377
-4.633
-3.03%
jan 1, 1988
143.744
-4.633
-3.12%
jan 1, 1989
137.5
-6.244
-4.34%
jan 1, 1990
131.257
-6.243
-4.54%
jan 1, 1991
125.013
-6.244
-4.76%
jan 1, 1992
118.769
-6.244
-4.99%
jan 1, 1993
112.525
-6.244
-5.26%
jan 1, 1994
109.491
-3.034
-2.7%
jan 1, 1995
106.457
-3.034
-2.77%
jan 1, 1996
103.424
-3.033
-2.85%
jan 1, 1997
100.39
-3.034
-2.93%
jan 1, 1998
97.356
-3.034
-3.02%
jan 1, 1999
96.438
-0.918
-0.94%
jan 1, 2000
95.52
-0.918
-0.95%
jan 1, 2001
94.602
-0.918
-0.96%
jan 1, 2002
93.683
-0.919
-0.97%
jan 1, 2003
92.765
-0.918
-0.98%
jan 1, 2004
92.506
-0.259
-0.28%
jan 1, 2005
92.247
-0.259
-0.28%
jan 1, 2006
91.988
-0.259
-0.28%
jan 1, 2007
91.728
-0.26
-0.28%
jan 1, 2008
91.469
-0.259
-0.28%
jan 1, 2009
89.612
-1.857
-2.03%
jan 1, 2010
87.756
-1.856
-2.07%
jan 1, 2011
85.899
-1.857
-2.12%
jan 1, 2012
84.042
-1.857
-2.16%
jan 1, 2013
82.185
-1.857
-2.21%
jan 1, 2014
81.181
-1.004
-1.22%
jan 1, 2015
80.176
-1.005
-1.24%
Ranking of countries by current statistics by years


Comments: