29
/
en
AIzaSyAYiBZKx7MnpbEhh9jyipgxe19OcubqV5w
April 1, 2024
140706
Ghana
GHA
true
2
1
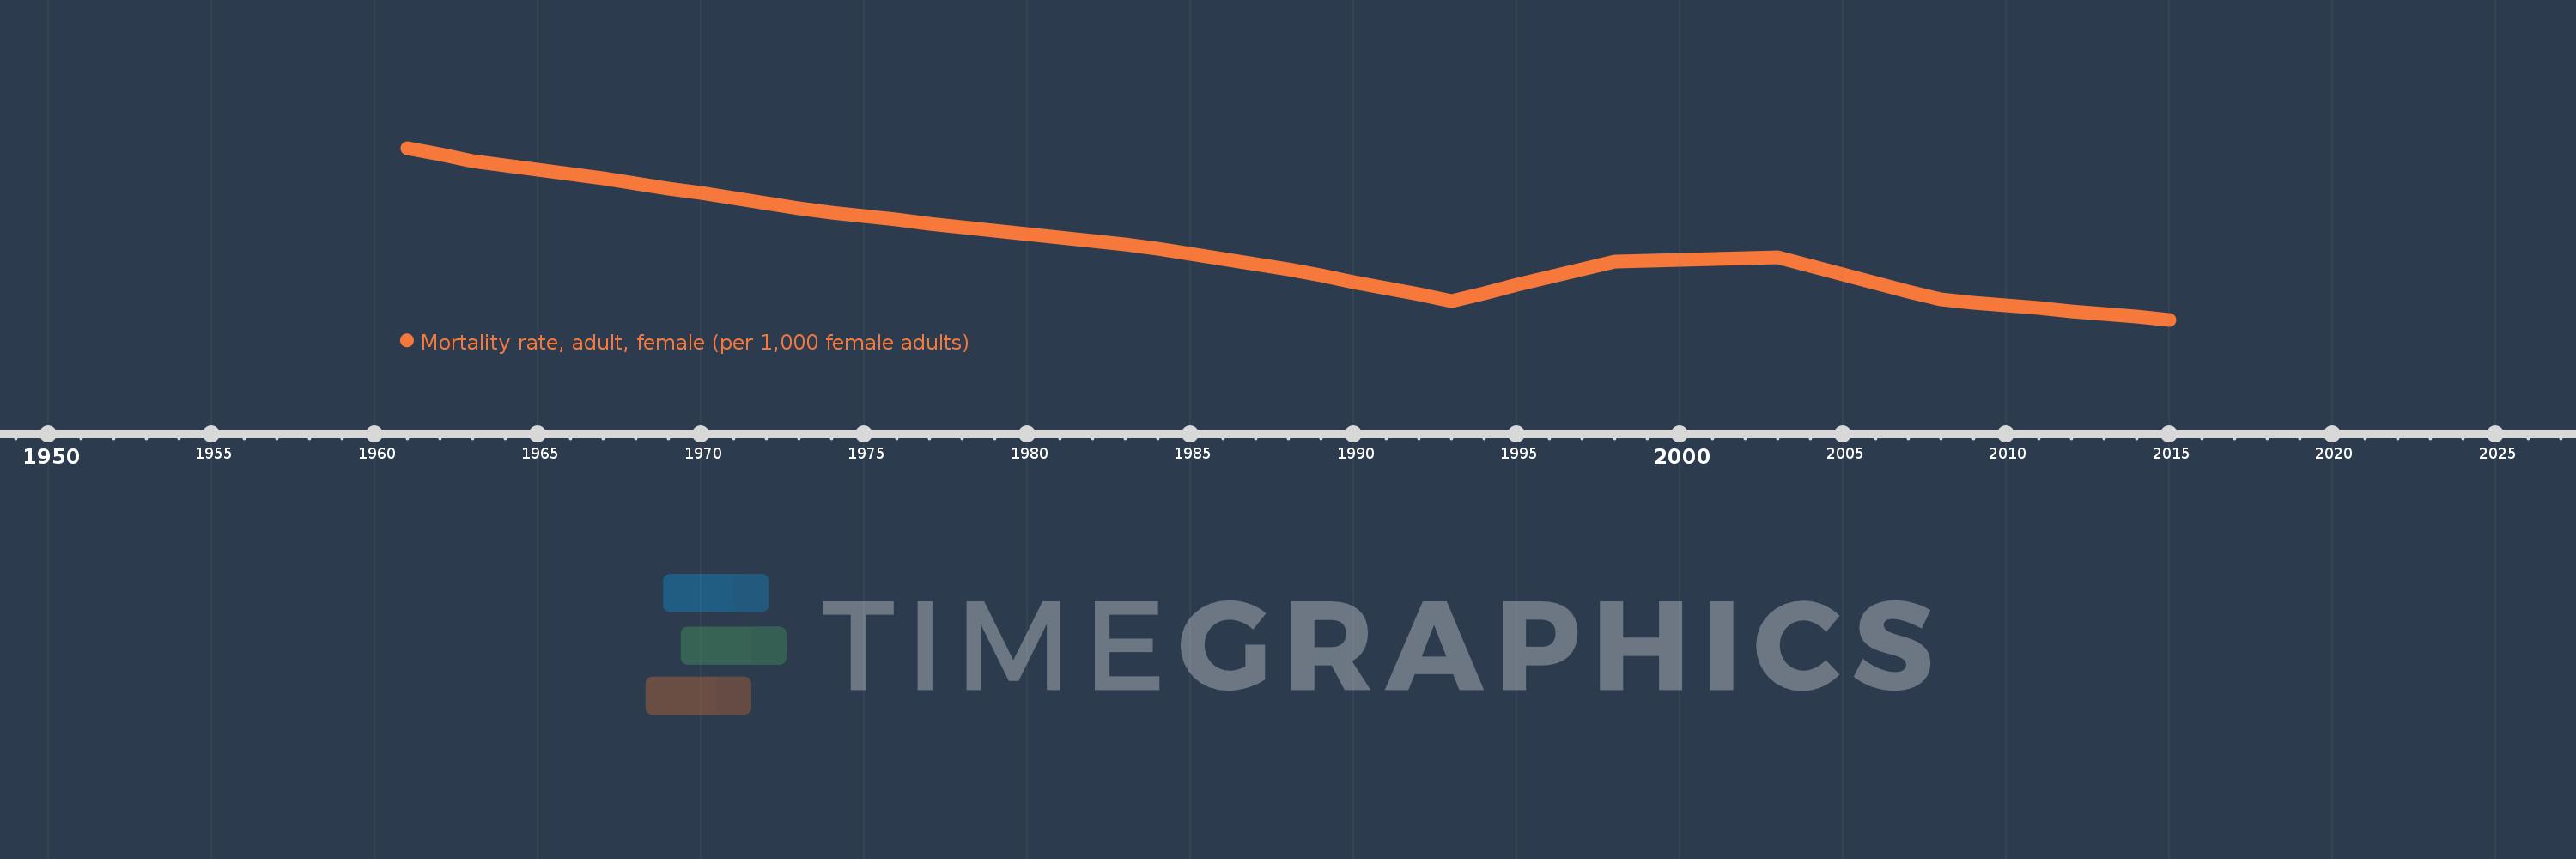
Mortality rate, adult, female (per 1,000 female adults)
2015,2014,2013,2012,2011,2010,2009,2008,2007,2006,2005,2004,2003,2002,2001,2000,1999,1998,1997,1996,1995,1994,1993,1992,1991,1990,1989,1988,1987,1986,1985,1984,1983,1982,1981,1980,1979,1978,1977,1976,1975,1974,1973,1972,1971,1970,1969,1968,1967,1966,1965,1964,1963,1962,1961
This statistics in other country:
AfghanistanAlbaniaAlgeriaAngolaAntigua and BarbudaArab WorldArgentinaArmeniaArubaAustraliaAustriaAzerbaijanBahamas, TheBahrainBangladeshBarbadosBelarusBelgiumBelizeBeninBhutanBoliviaBosnia and HerzegovinaBotswanaBrazilBrunei DarussalamBulgariaBurkina FasoBurundiCabo VerdeCambodiaCameroonCanadaCaribbean small statesCentral African RepublicCentral Europe and the BalticsChadChannel IslandsChileChinaColombiaComorosCongo, Dem. Rep.Congo, Rep.Costa RicaCote d'IvoireCroatiaCubaCuracaoCyprusCzech RepublicDenmarkDjiboutiDominicaDominican RepublicEarly-demographic dividendEast Asia & PacificEast Asia & Pacific (excluding high income)East Asia & Pacific (IDA & IBRD countries)EcuadorEgypt, Arab Rep.El SalvadorEquatorial GuineaEritreaEstoniaEthiopiaEuro areaEurope & Central AsiaEurope & Central Asia (excluding high income)Europe & Central Asia (IDA & IBRD countries)European UnionFijiFinlandFragile and conflict affected situationsFranceFrench PolynesiaGabonGambia, TheGeorgiaGermanyGhanaGreeceGreenlandGrenadaGuamGuatemalaGuineaGuinea-BissauGuyanaHaitiHeavily indebted poor countries (HIPC)High incomeHondurasHong Kong SAR, ChinaHungaryIBRD onlyIcelandIDA & IBRD totalIDA blendIDA onlyIDA totalIndiaIndonesiaIran, Islamic Rep.IraqIrelandIsraelItalyJamaicaJapanJordanKazakhstanKenyaKiribatiKorea, Dem. People’s Rep.Korea, Rep.KuwaitKyrgyz RepublicLao PDRLate-demographic dividendLatin America & Caribbean Latin America & Caribbean (excluding high income)Latin America & the Caribbean (IDA & IBRD countries)LatviaLeast developed countries: UN classificationLebanonLesothoLiberiaLibyaLithuaniaLow & middle incomeLow incomeLower middle incomeLuxembourgMacao SAR, ChinaMacedonia, FYRMadagascarMalawiMalaysiaMaldivesMaliMaltaMarshall IslandsMauritaniaMauritiusMexicoMicronesia, Fed. Sts.Middle East & North AfricaMiddle East & North Africa (excluding high income)Middle East & North Africa (IDA & IBRD countries)Middle incomeMoldovaMongoliaMontenegroMoroccoMozambiqueMyanmarNamibiaNepalNetherlandsNew CaledoniaNew ZealandNicaraguaNigerNigeriaNorth AmericaNorwayOECD membersOmanOther small statesPacific island small statesPakistanPanamaPapua New GuineaParaguayPeruPhilippinesPolandPortugalPost-demographic dividendPre-demographic dividendPuerto RicoQatarRomaniaRussian FederationRwandaSamoaSao Tome and PrincipeSaudi ArabiaSenegalSerbiaSeychellesSierra LeoneSingaporeSlovak RepublicSloveniaSmall statesSolomon IslandsSomaliaSouth AfricaSouth AsiaSouth Asia (IDA & IBRD)South SudanSpainSri LankaSt. Kitts and NevisSt. LuciaSt. Vincent and the GrenadinesSub-Saharan Africa Sub-Saharan Africa (excluding high income)Sub-Saharan Africa (IDA & IBRD countries)SudanSurinameSwazilandSwedenSwitzerlandSyrian Arab RepublicTajikistanTanzaniaThailandTimor-LesteTogoTongaTrinidad and TobagoTunisiaTurkeyTurkmenistanUgandaUkraineUnited Arab EmiratesUnited KingdomUnited StatesUpper middle incomeUruguayUzbekistanVanuatuVenezuela, RBVietnamVirgin Islands (U.S.)West Bank and GazaWorldYemen, Rep.ZambiaZimbabwe Timeline:
This timeline shows a graph from 1961 to 2015 of Ghana. No data until 1960. Number of actual observations by date: 55.
Source name:
World Development Indicators
Source organization:
(1) United Nations Population Division. World Population Prospects. New York, United Nations, Department of Economic and Social Affairs (advanced Excel tables). Available at http://esa.un.org/wpp/unpp/panel_population.htm, (2) University of California, Berkeley, and Max Planck Institute for Demographic Research. Human Mortality Database. [ www.mortality.org or www.humanmortality.de].
Categories, topics:
Health, Gender
Last updated:
apr 23, 2017
Indicators value changes by year
Minimum:
231.044
jan 1, 2015
Maximum:
368.978
jan 1, 1961
At the date of observation
Value
Absolute change
Change from previous value
jan 1, 1961
368.978
+368.978
0.0%
jan 1, 1962
363.868
-5.11
-1.38%
jan 1, 1963
358.757
-5.111
-1.4%
jan 1, 1964
355.155
-3.602
-1.0%
jan 1, 1965
351.554
-3.601
-1.01%
jan 1, 1966
347.953
-3.601
-1.02%
jan 1, 1967
344.351
-3.602
-1.04%
jan 1, 1968
340.75
-3.601
-1.05%
jan 1, 1969
336.667
-4.083
-1.2%
jan 1, 1970
332.584
-4.083
-1.21%
jan 1, 1971
328.501
-4.083
-1.23%
jan 1, 1972
324.418
-4.083
-1.24%
jan 1, 1973
320.334
-4.084
-1.26%
jan 1, 1974
317.304
-3.03
-0.95%
jan 1, 1975
314.273
-3.031
-0.96%
jan 1, 1976
311.242
-3.031
-0.96%
jan 1, 1977
308.211
-3.031
-0.97%
jan 1, 1978
305.18
-3.031
-0.98%
jan 1, 1979
302.511
-2.669
-0.87%
jan 1, 1980
299.842
-2.669
-0.88%
jan 1, 1981
297.172
-2.67
-0.89%
jan 1, 1982
294.503
-2.669
-0.9%
jan 1, 1983
291.833
-2.67
-0.91%
jan 1, 1984
287.759
-4.074
-1.4%
jan 1, 1985
283.684
-4.075
-1.42%
jan 1, 1986
279.609
-4.075
-1.44%
jan 1, 1987
275.535
-4.074
-1.46%
jan 1, 1988
271.46
-4.075
-1.48%
jan 1, 1989
266.403
-5.057
-1.86%
jan 1, 1990
261.346
-5.057
-1.9%
jan 1, 1991
256.289
-5.057
-1.93%
jan 1, 1992
251.233
-5.056
-1.97%
jan 1, 1993
246.176
-5.057
-2.01%
jan 1, 1994
252.555
+6.379
2.59%
jan 1, 1995
258.934
+6.379
2.53%
jan 1, 1996
265.314
+6.38
2.46%
jan 1, 1997
271.693
+6.379
2.4%
jan 1, 1998
278.072
+6.379
2.35%
jan 1, 1999
278.695
+0.623
0.22%
jan 1, 2000
279.318
+0.623
0.22%
jan 1, 2001
279.94
+0.622
0.22%
jan 1, 2002
280.563
+0.623
0.22%
jan 1, 2003
281.185
+0.622
0.22%
jan 1, 2004
274.368
-6.817
-2.42%
jan 1, 2005
267.551
-6.817
-2.48%
jan 1, 2006
260.733
-6.818
-2.55%
jan 1, 2007
253.916
-6.817
-2.61%
jan 1, 2008
247.098
-6.818
-2.69%
jan 1, 2009
244.817
-2.281
-0.92%
jan 1, 2010
242.536
-2.281
-0.93%
jan 1, 2011
240.256
-2.28
-0.94%
jan 1, 2012
237.975
-2.281
-0.95%
jan 1, 2013
235.694
-2.281
-0.96%
jan 1, 2014
233.369
-2.325
-0.99%
jan 1, 2015
231.044
-2.325
-1.0%
Ranking of countries by current statistics by years


Comments: